How Much Does Housing Cost in Australia and How the Market Has Changed Since the 2021 Peak
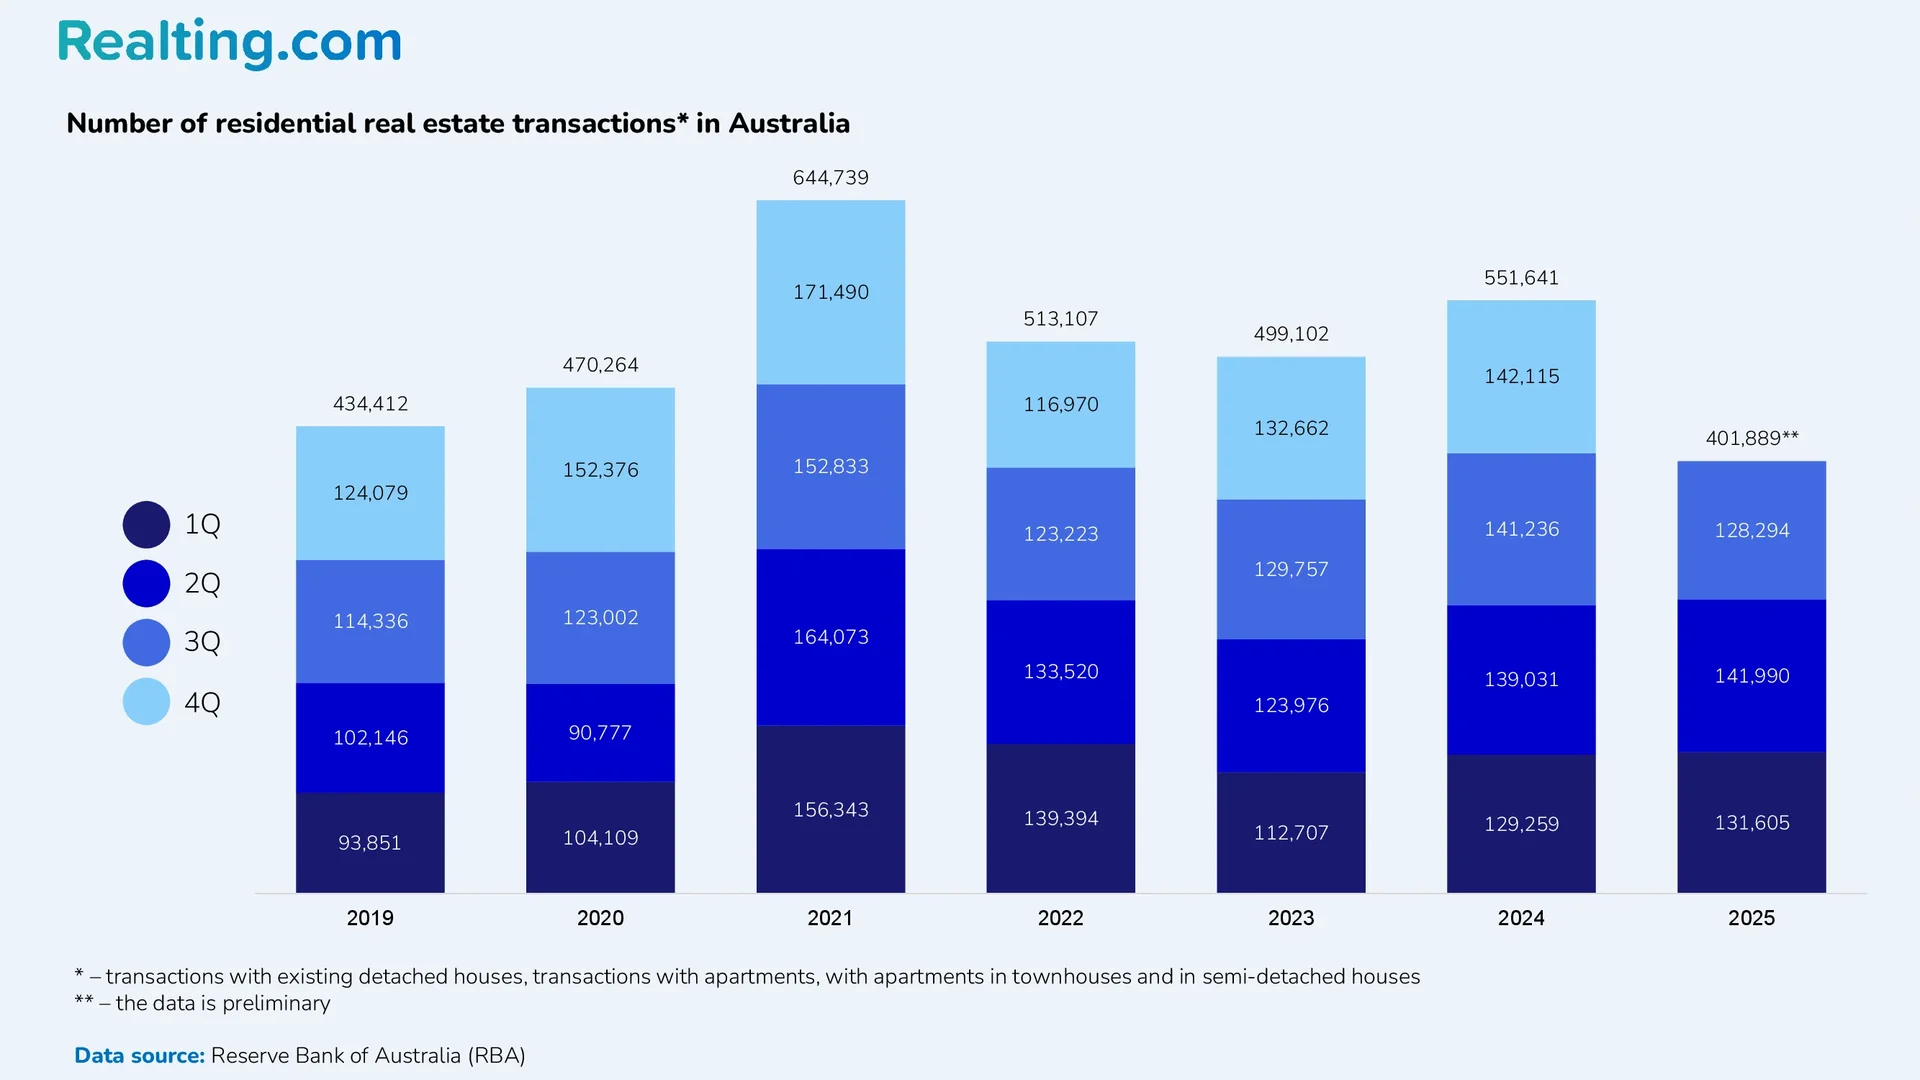
Last year became the second most successful year on the Australian residential real estate market in the last 15 years. The absolute record holder remains 2021, when 644,739 residential real estate purchase and sale transactions were registered – likely the highest result for the country since the beginning of the century.
Historical Context: From the 2021 Records to the Realities of 2024
Record 2021 was driven by many factors, the most important of which were:
- Historically low mortgage interest rates. Average interest rates on new home loans in 2021 fell to 2.5% and below.
- Government support programs – HomeBuilder and First Home Buyer – acted as a stimulus for home purchases. The media at that time noted that these programs helped shift demand from future years into 2021.
- Pent-up demand after the pandemic played a significant role.
If the record result in 2021 looks quite understandable and logical, the performance of 2024 is of interest. Unlike 2021, when mortgage rates were historically low, in 2024 they, on the contrary, remained at the highest level: the average mortgage interest rate was 6.24%. It is also worth noting that the level of government support in 2024 was significantly lower than in 2021. Despite high rates and reduced government support, the high activity in the 2024 market was formed by the following factors:
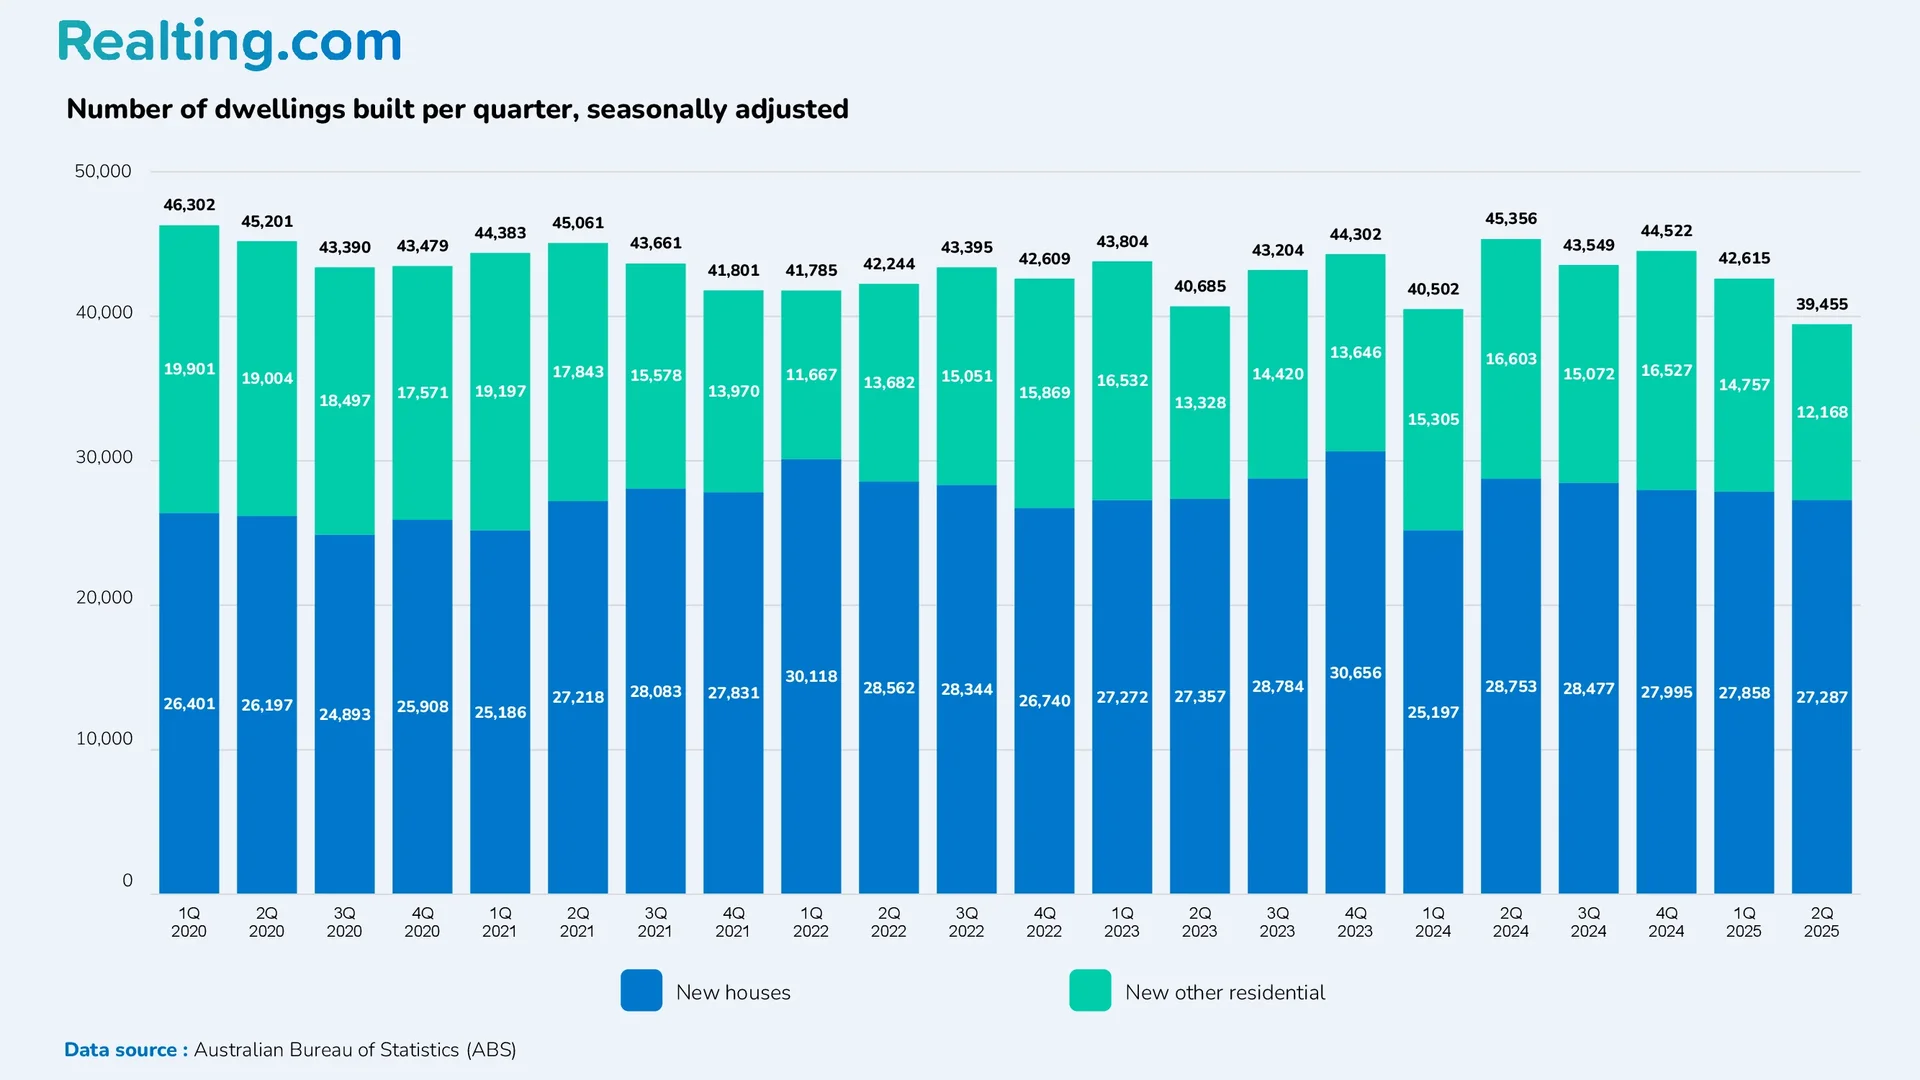
- Australia has been experiencing a chronic housing shortage for a long time. Demand significantly exceeds supply. In turn, the volume of new construction in 2024 and the preceding 2023 decreased significantly. High demand and housing shortage stimulate the population to buy up housing despite high rates and rising prices.
- Population growth, particularly of the adult population, due to concentrated migration in 2023 and 2024, after migration flows were frozen during and after the pandemic.
- The rental market with rapid rent growth was also one of the incentives for buying own housing.
- High loan rates redistributed demand to more affordable regions and forced buyers to pay attention to cheaper residential real estate segments.
Fundamental Demand Factors and the Mortgage Market
Before talking about the results of the residential real estate market in 2025, let us discuss the factors that contributed to these results.
One of the most important events for the Australian housing market in 2025 was the long-awaited reduction in mortgage interest rates.
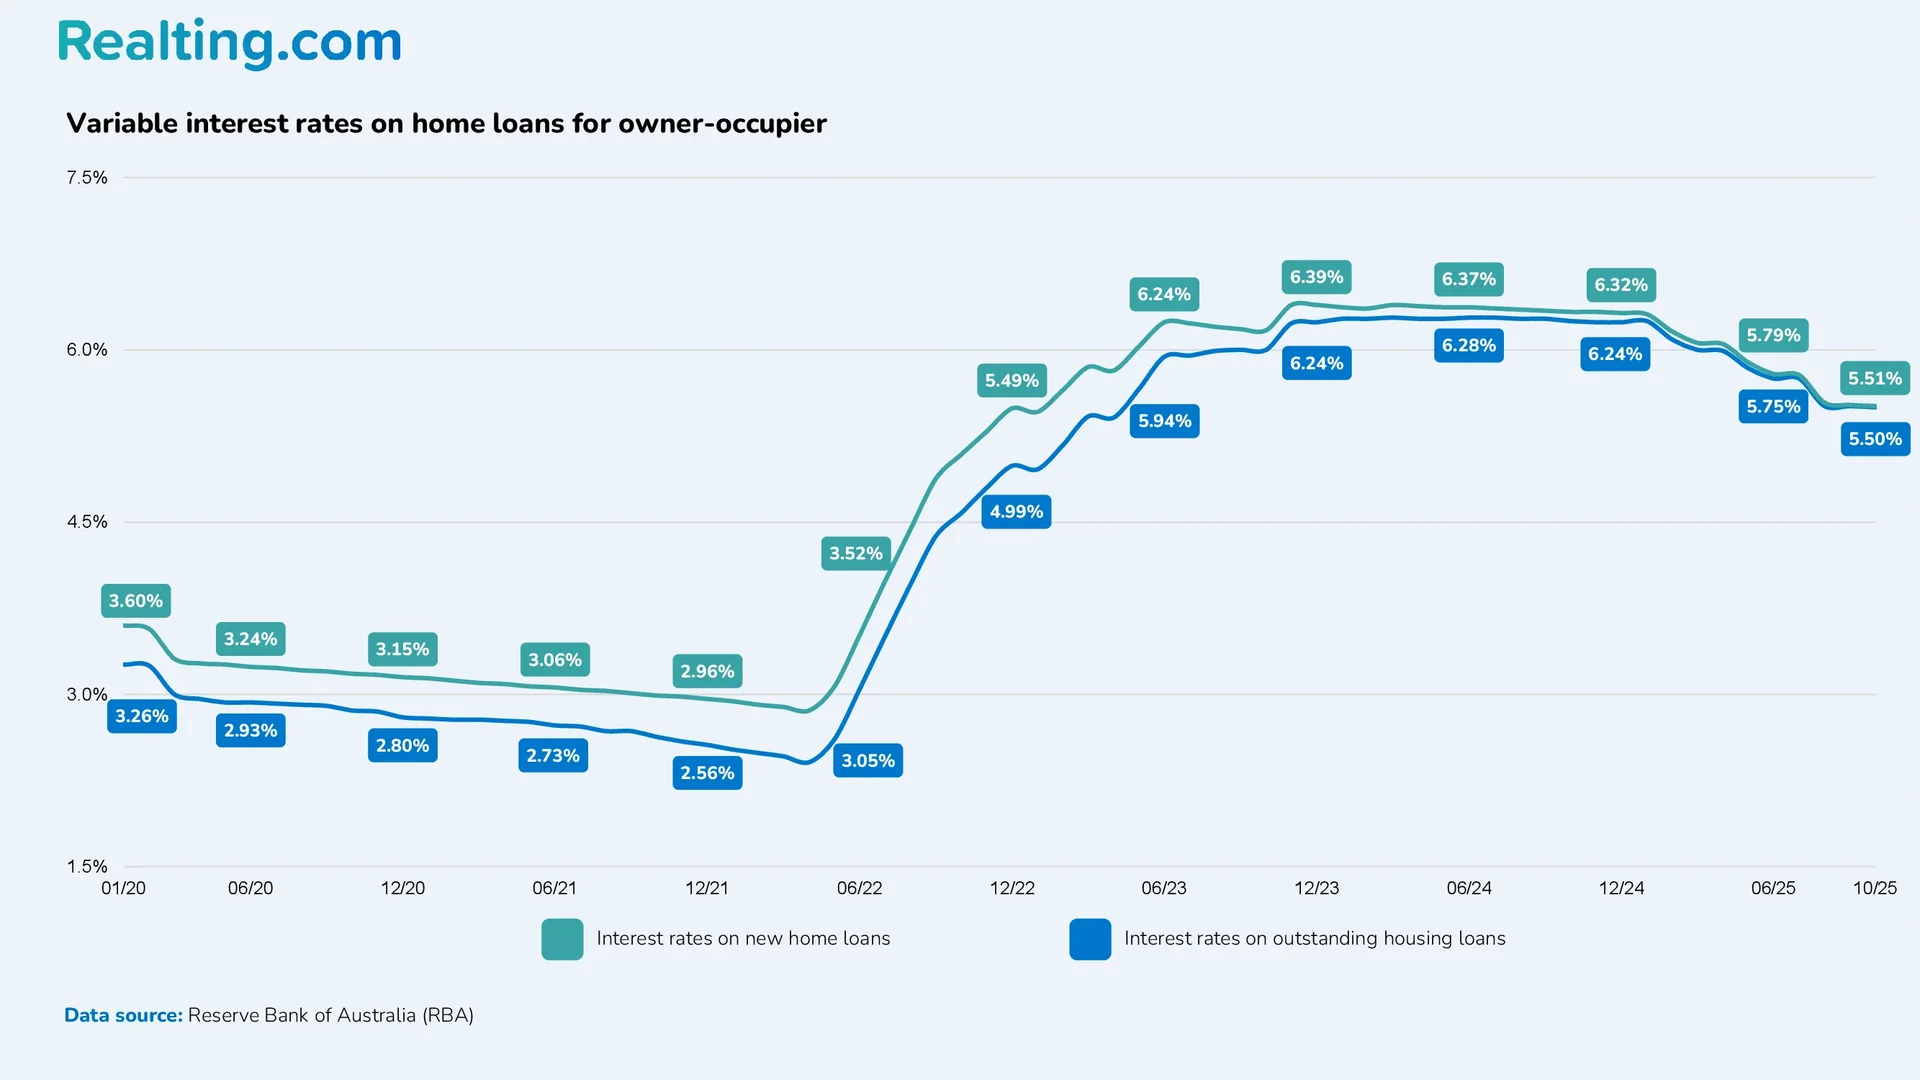
According to Reserve Bank of Australia statistics, mortgage interest rates decreased throughout 2025. If at the beginning of the year the average interest rate for new home loans was 6.25%, then by October the rate had dropped to 5.50%. However, current loan rates are still much higher than a few years ago.
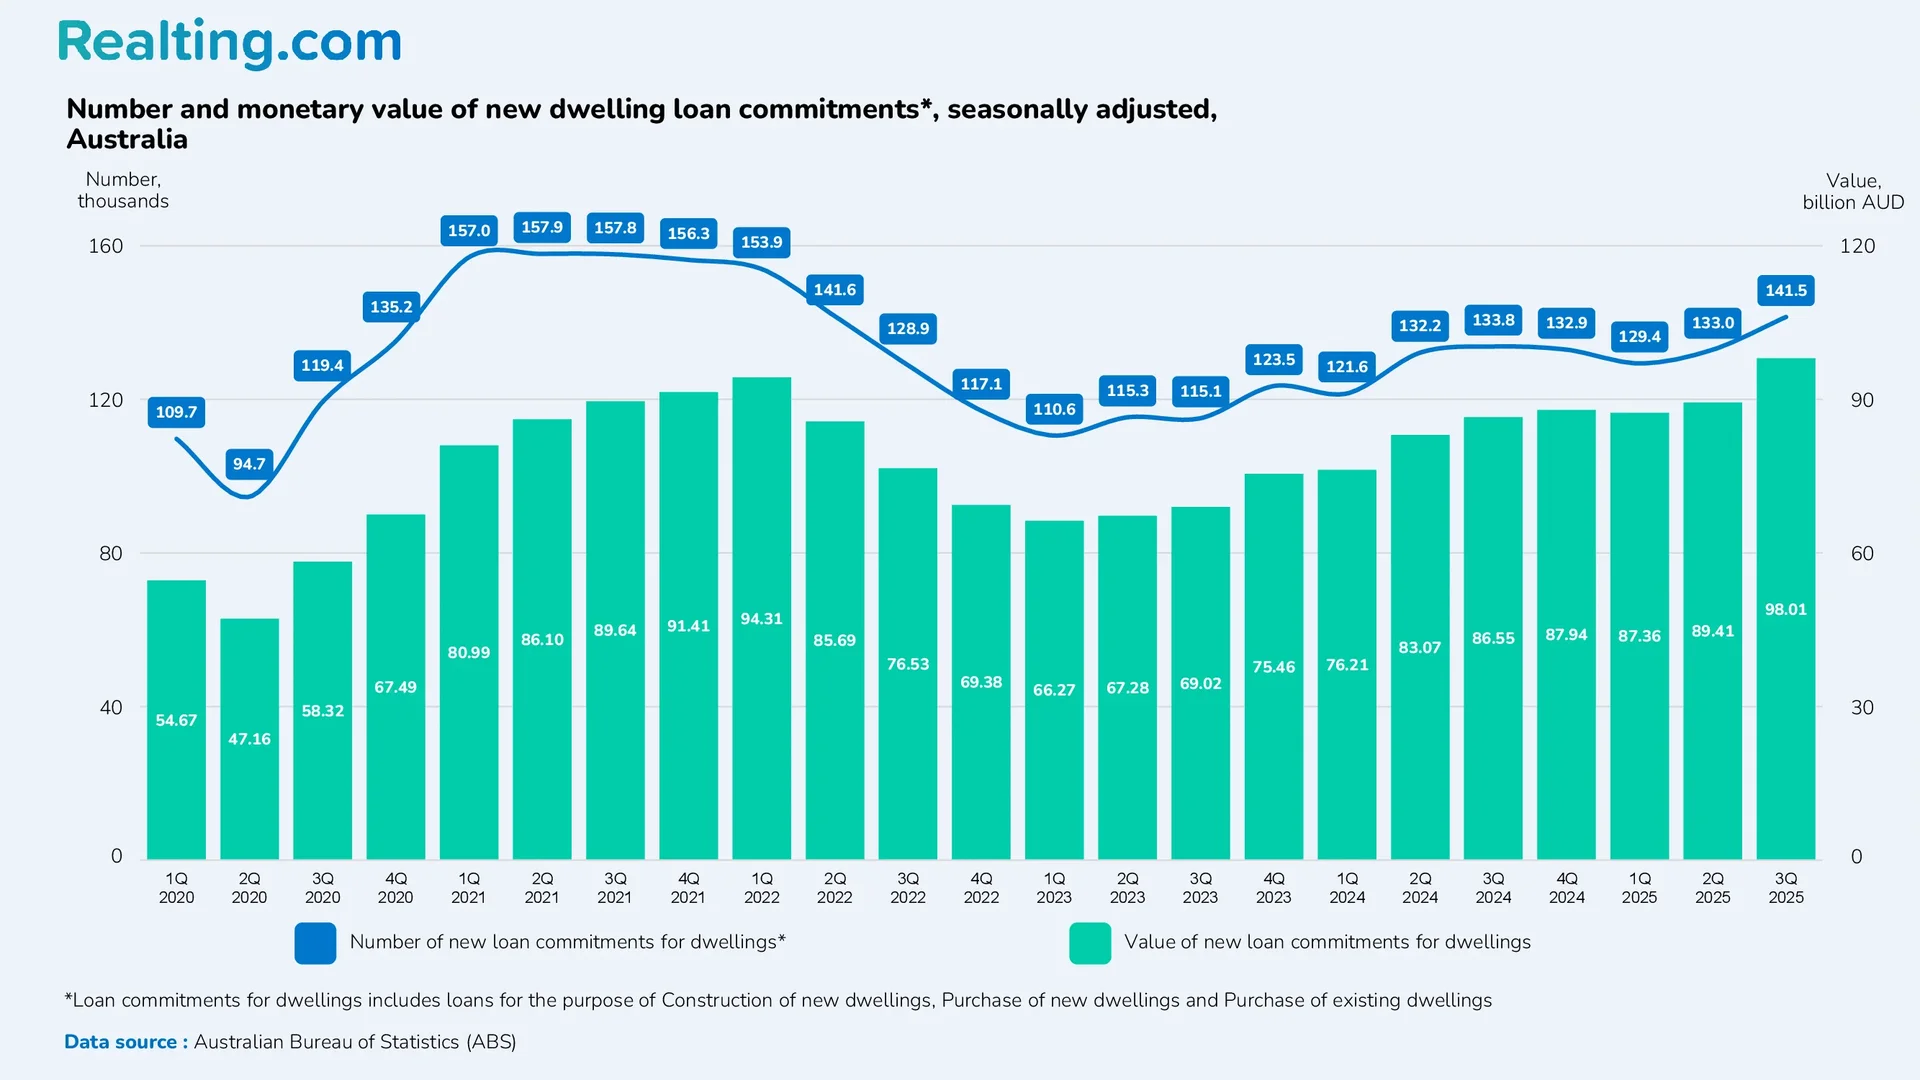
Following the rate reduction, both the number of new home loans and their volume increased. The number of new home loans issued in the 3rd quarter of 2025 amounted to 141,470, which is 5.76% more than in the 3rd quarter of 2024. The volume of new loans issued amounted to 98.01 billion AUD, which is 13.23% more than in the 3rd quarter of the previous year. Note that 59.3% of all loans were issued for owner-occupation purposes; the remaining 40.7% are investment loans. Investment loans are generally more expensive in terms of interest rates and require a higher down payment.
Despite the rate reduction, housing affordability remains the main problem on the market. Experts of the Australian housing market say that price growth largely offsets the effect of rate reductions.
Buyer demand still significantly exceeds supply. Unfortunately, new housing construction is not keeping pace with the growing appetite of potential buyers. It is also important to add that the number of buyers is only growing, facilitated by migration.
Transaction Statistics: Preliminary Results of the First Three Quarters of 2025
Finally, let us move on to how many housing transactions were registered in the 3rd quarter of 2025.
According to the Australian Bureau of Statistics, 128,294 residential real estate purchase and sale transactions were registered in the country in the 3rd quarter of 2025. The number of transactions in the 3rd quarter of 2025 was 9.65% less than in the 2nd quarter of the same year and 9.16% less than in the 3rd quarter of 2024.
In total, over the first three quarters of 2025, 401,889 residential real estate transactions were registered in Australia – slightly less (by 1.86%) than in the same period of 2024, when 409,526 transactions were registered. It should be noted that the total number of housing transactions for the period from the first to the third quarter of 2025 is the third-best result in the last 15 years among similar periods.
It is important to add that the above data are preliminary and will be revised. This means that in the future, the final number of transactions in the 3rd and 2nd quarters of 2025 will increase. As 2025 is coming to an end, in the first quarter of next year, the Australian Bureau of Statistics will publish data on the number of transactions in the last quarter of 2025, as well as a preliminary estimate of the total number of housing transactions for the entire 2025 year. Already now we can say that the final number of transactions on the residential real estate market in 2025 will be at least comparable to the 2024 result, and at most exceed it.
Market Structure: Popularity of Detached Houses and Sales Geography
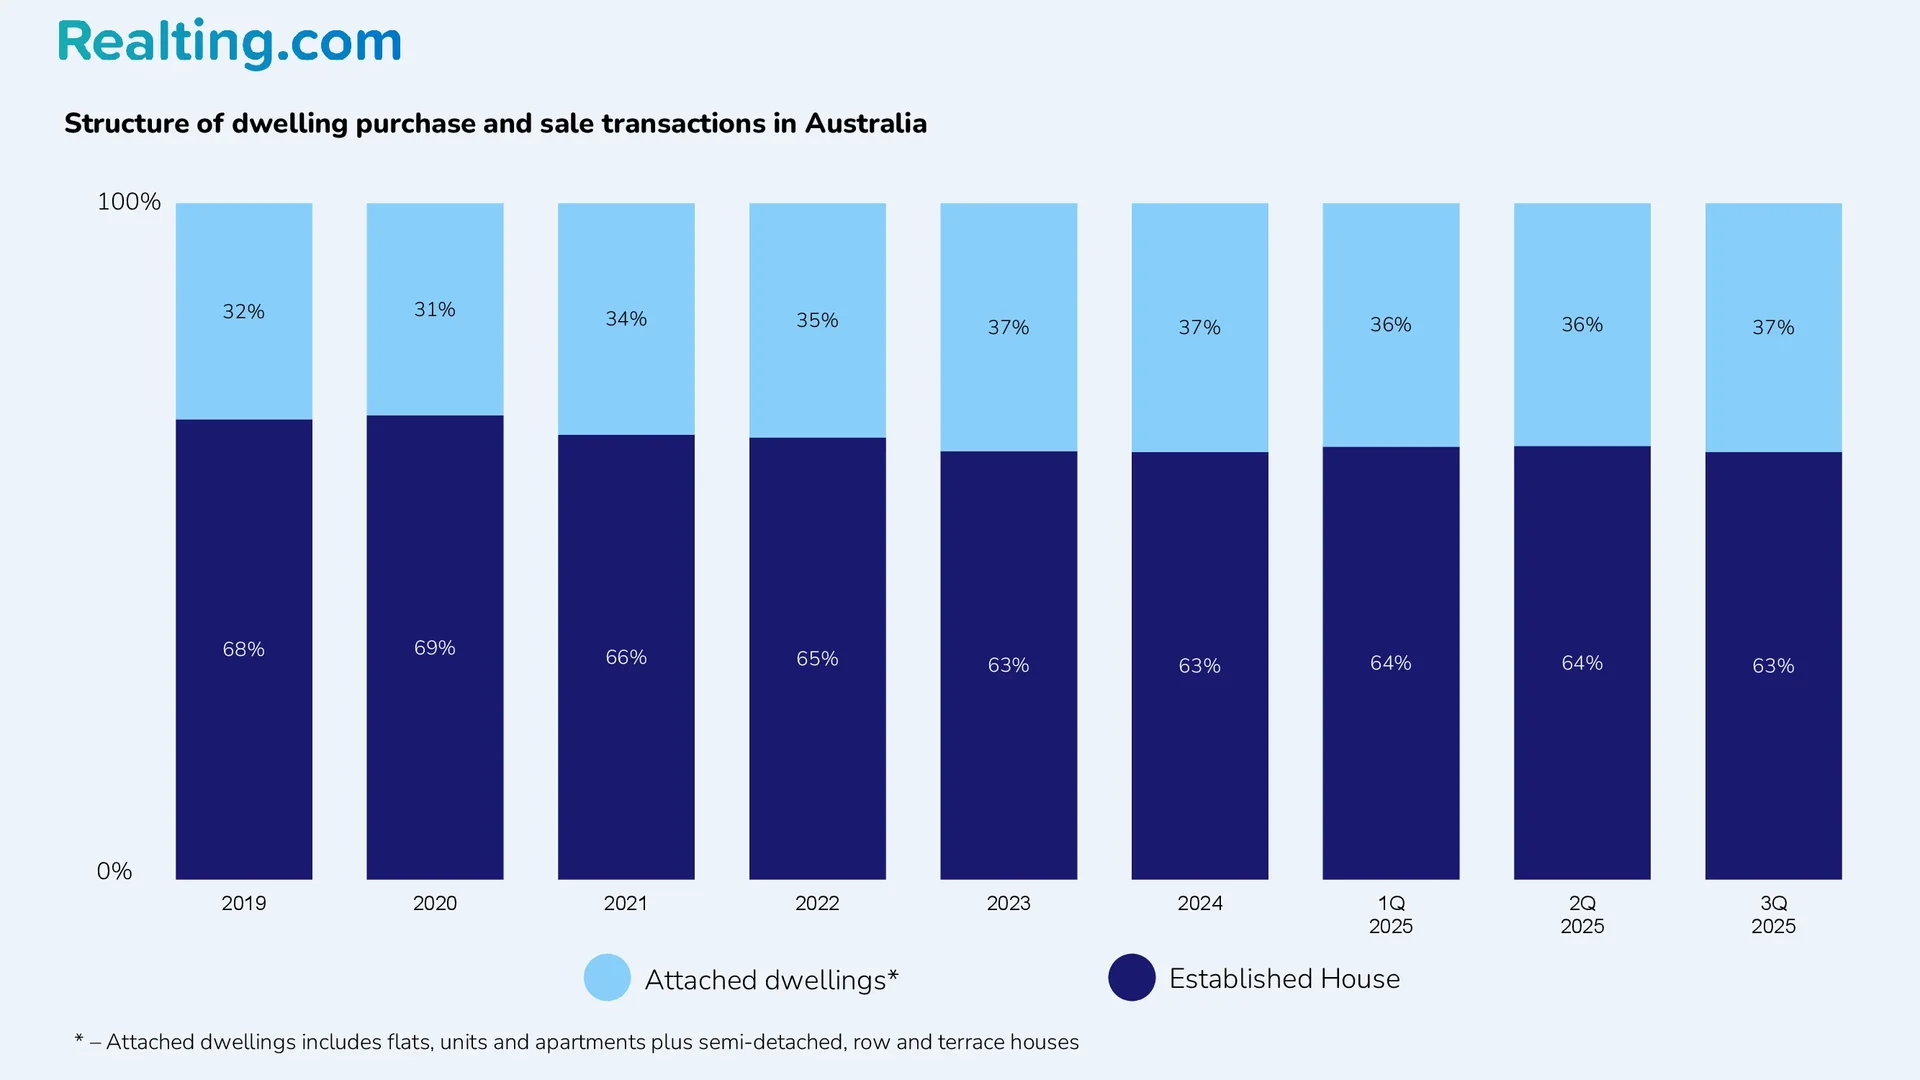
Traditionally, detached houses (Established house*) are the most popular on the Australian housing market, accounting for almost two-thirds of all housing transactions in the country. All other housing transactions are deals with attached dwellings**, which also include townhouses, semi-detached houses, and apartments.
*Established house – standalone residential house on its own land plot.
**Attached dwellings – apartments, units, semi-detached houses, townhouses
The eight largest cities in Australia, which are also state capitals (except Canberra), accounted for 65.3% of all residential real estate transactions in the country.
Among Australian cities, Sydney and Melbourne are the leaders in the number of housing transactions. In the 3rd quarter of 2025, 25,115 and 25,683 housing purchase and sale transactions were registered respectively. It should also be added that the structure of transactions in them differs from the national structure. In Sydney in the 3rd quarter of 2025, the shares of house and apartment transactions were almost equal. In Melbourne, 53% of transactions were made with houses, the rest – with apartments.
In the capital of Australia, Canberra, in the 3rd quarter of this year, 1,983 housing transactions were registered, of which 944 were house transactions.
Residential Real Estate Price Dynamics in Australia by State
The median residential real estate price in purchase and sale transactions in Australia in the 3rd quarter of 2025 was 1,045,400 AUD (Australian dollars) or 683,308 USD – such data is provided by the Australian Bureau of Statistics. The median housing price in transactions across the whole country increased by 6.04% in national currency and by 2.79% in US dollars over the year.
Median housing price by states and territories of Australia, thousand AUD:
|
State, Territory |
1Q 2025 |
2Q 2025 |
3Q 2025 |
Annual price change in 3Q 2025 |
|
New South Wales |
1248.3 |
1271.7 |
1295.9 |
+5.05% |
|
Victoria |
910.2 |
909.6 |
918.5 |
+3.17% |
|
Queensland |
957.7 |
971.7 |
1005.6 |
+9.82% |
|
South Australia |
845.2 |
867.3 |
887 |
+8.77% |
|
Western Australia |
879.9 |
907.1 |
947.9 |
+9.72% |
|
Tasmania |
676.2 |
665.9 |
669.3 |
+2.54% |
|
Northern Territory |
502.3 |
535.7 |
564.1 |
+6.21% |
|
Australian Capital Territory (Canberra) |
939.1 |
953 |
968.1 |
+1.71% |
|
Australia overall |
1007.8 |
1022.4 |
1045.4 |
+6.04% |
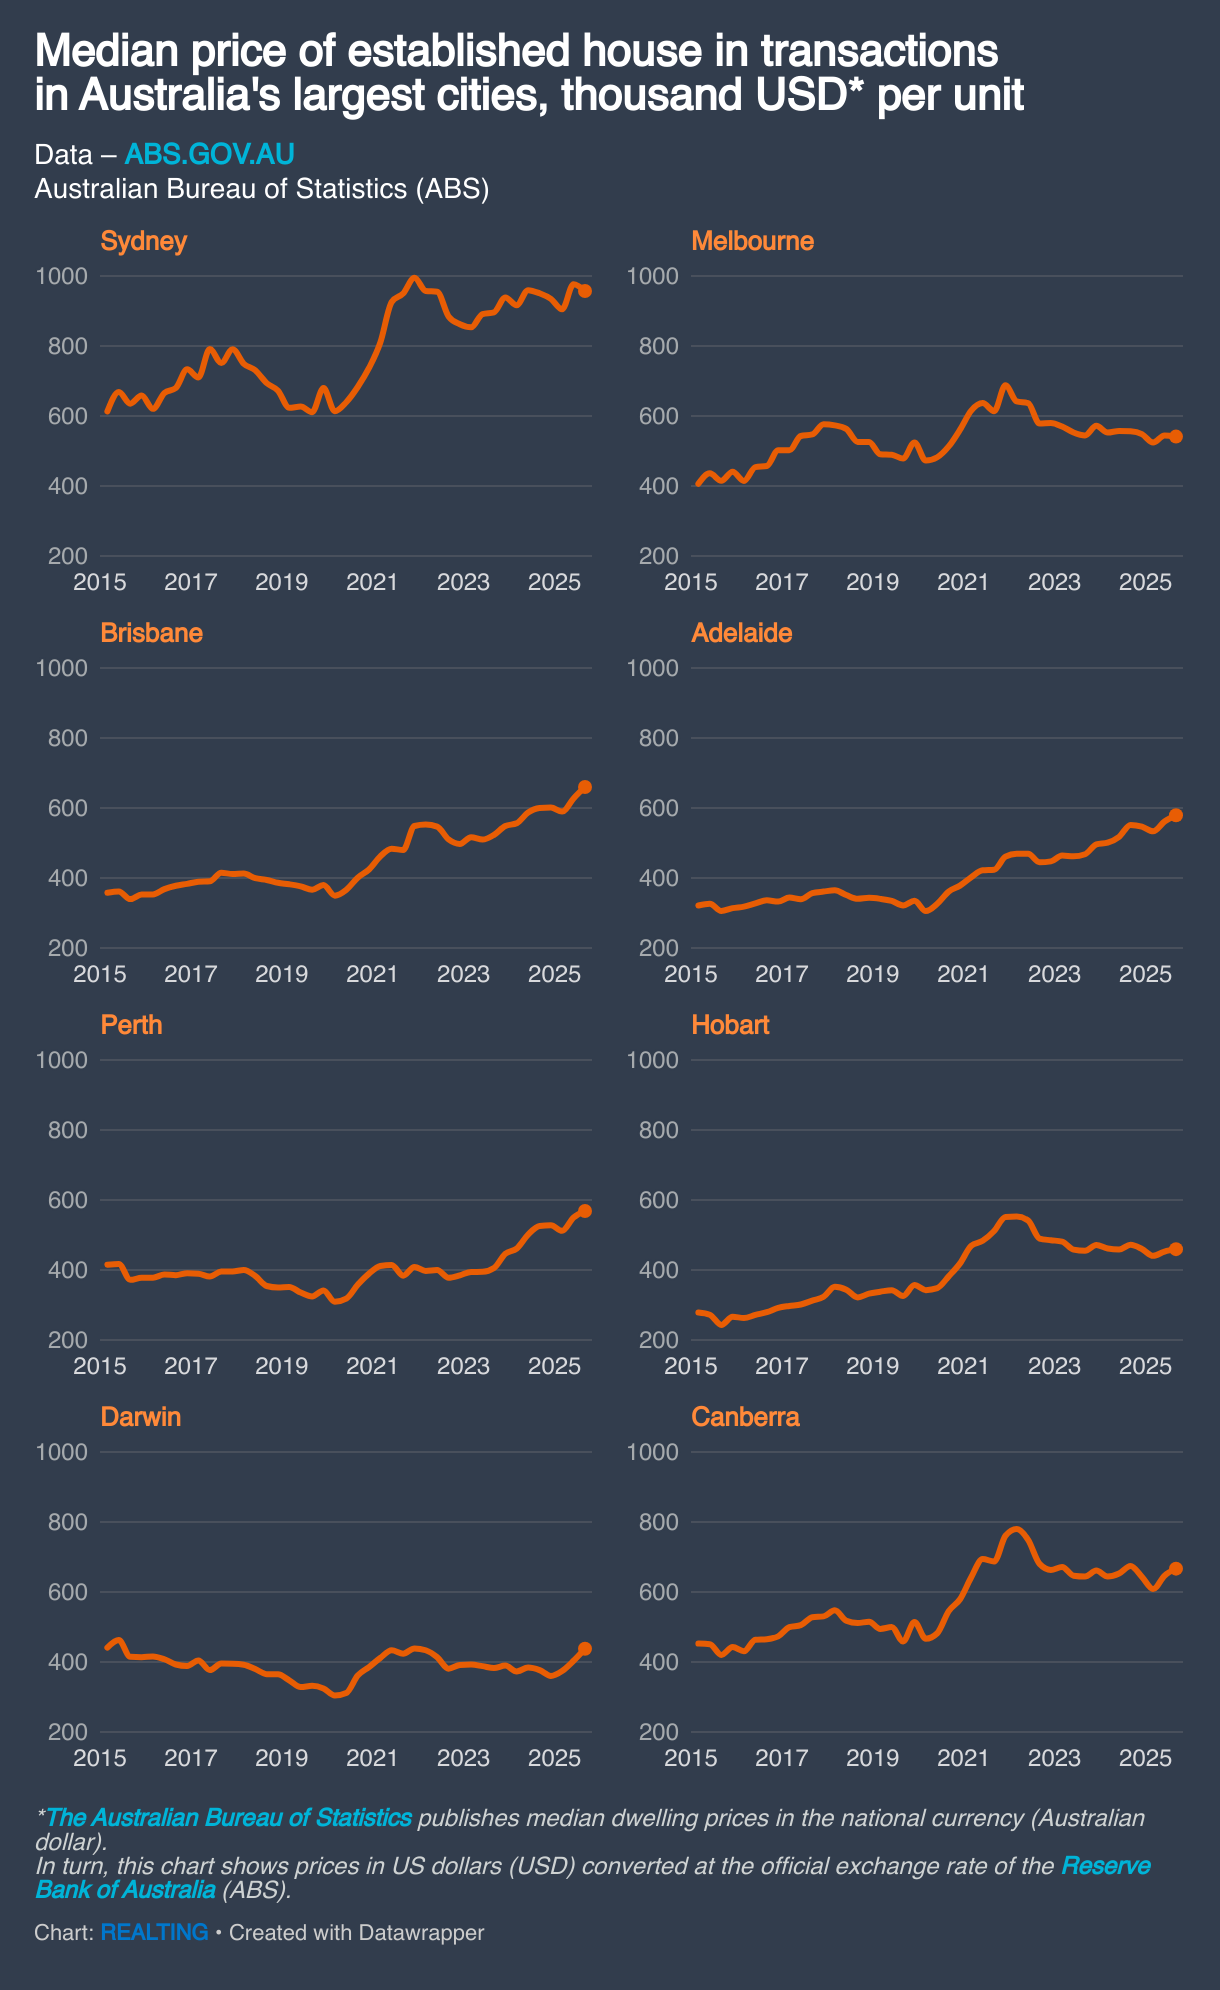
Below are charts with median prices for houses (Established house) and apartments (Attached dwellings) in purchase and sale transactions in the eight largest cities of Australia. Median prices on the charts are presented both in Australian national currency (AUD) and in US dollars (USD). We also provide tables containing data on how housing prices have changed over 1 year, 5 years, and 10 years in the largest cities of the country and states of the country, excluding capitals.
Median price of houses (Established house) in the 3rd quarter of 2025 in purchase and sale transactions, thousand AUD, and its change
|
City, State* |
Median price, thousand AUD |
Y25/Y24 |
Y25/Y20 |
Y25/Y15 |
|
Sydney |
1464.50 |
+3.87% |
+54.97% |
+64.88% |
|
New South Wales* (excl. Sydney) |
770.00 |
+3.36% |
+50.98% |
+87.80% |
|
Melbourne |
828.00 |
+0.36% |
+16.62% |
+42.76% |
|
Victoria* (excl. Melbourne) |
580.00 |
+3.76% |
+41.46% |
+96.21% |
|
Brisbane |
1010.00 |
+13.48% |
+81.98% |
+112.63% |
|
Queensland* (excl. Brisbane) |
755.00 |
+16.33% |
+68.15% |
+81.93% |
|
Adelaide |
886.00 |
+8.27% |
+77.20% |
+107.25% |
|
South Australia* (excl. Adelaide) |
535.00 |
+15.05% |
+87.72% |
+105.77% |
|
Perth |
870.00 |
+11.54% |
+75.76% |
+67.31% |
|
Western Australia* (excl. Perth) |
575.00 |
+16.16% |
+57.53% |
+64.29% |
|
Hobart |
703.20 |
+0.46% |
+33.06% |
+106.82% |
|
Tasmania* (excl. Hobart) |
566.80 |
+10.06% |
+61.94% |
+120.12% |
|
Darwin |
670.00 |
+19.90% |
+34.00% |
+15.52% |
|
Northern Territory* (excl. Darwin) |
433.00 |
+2.44% |
-1.59% |
-4.84% |
|
Canberra |
1020.00 |
+2.00% |
+35.10% |
+73.62% |
– For states, the median price is shown excluding transactions in their capitals. Y25/Y24 – change in median price in purchase and sale transactions in the 3rd quarter of 2025 compared to the 3rd quarter of 2024 Y25/Y20 – change compared to the 3rd quarter of 2020 Y25/Y15 – change compared to the 3rd quarter of 2015

Median price of apartments (Attached dwellings) in the 3rd quarter of 2025 in purchase and sale transactions, thousand AUD, and its change:
|
City, State* |
Median price, thousand AUD |
Y25/Y24 |
Y25/Y20 |
Y25/Y15 |
|
Sydney |
830.00 |
+2.18% |
+13.70% |
+16.90% |
|
New South Wales* (excl. Sydney) |
670.00 |
+4.69% |
+41.05% |
+86.11% |
|
Melbourne |
620.00 |
+0.49% |
+4.20% |
+24.00% |
|
Victoria* (excl. Melbourne) |
435.00 |
+3.45% |
+20.83% |
+69.92% |
|
Brisbane |
738.00 |
+16.96% |
+84.50% |
+73.65% |
|
Queensland* (excl. Brisbane) |
735.50 |
+11.44% |
+78.30% |
+109.66% |
|
Adelaide |
681.00 |
+11.64% |
+65.37% |
+97.68% |
|
South Australia* (excl. Adelaide) |
361.50 |
+44.89% |
+79.85% |
+90.26% |
|
Perth |
625.00 |
+15.74% |
+62.34% |
+47.06% |
|
Western Australia* (excl. Perth) |
423.60 |
+11.47% |
+71.50% |
+28.36% |
|
Hobart |
570.00 |
+8.57% |
+35.71% |
+92.57% |
|
Tasmania* (excl. Hobart) |
450.00 |
- |
+47.54% |
+91.49% |
|
Darwin |
407.00 |
+16.29% |
+42.81% |
-14.32% |
|
Northern Territory* (excl. Darwin) |
310.00 |
+10.71% |
+6.90% |
+1.64% |
|
Canberra |
610.00 |
+2.52% |
+25.00% |
+46.99% |


Forecast for 2026
Australia is seeing annual housing price growth across the entire country; both houses and apartments are rising in price. Housing price growth is an expected effect in the current situation for Australia, when demand has been at a high level for a long time, and supply cannot compensate for this demand. The pace of new residential construction and the increased influx of new population due to migration add fuel to the fire. The above factors indicate that housing prices will continue the upward trend in 2026.