Where to Buy Real Estate in Egypt: Overview of Districts and Prices
The Egyptian residential real estate market in 2025 demonstrated significant growth. The Aqarmap residential real estate index, which reflects the overall state of the Egyptian real estate sector, as of October 2025 showed an increase of +13.25% year-over-year (it settled at 6240 points). Over the past five years, it has increased 2.3 times.
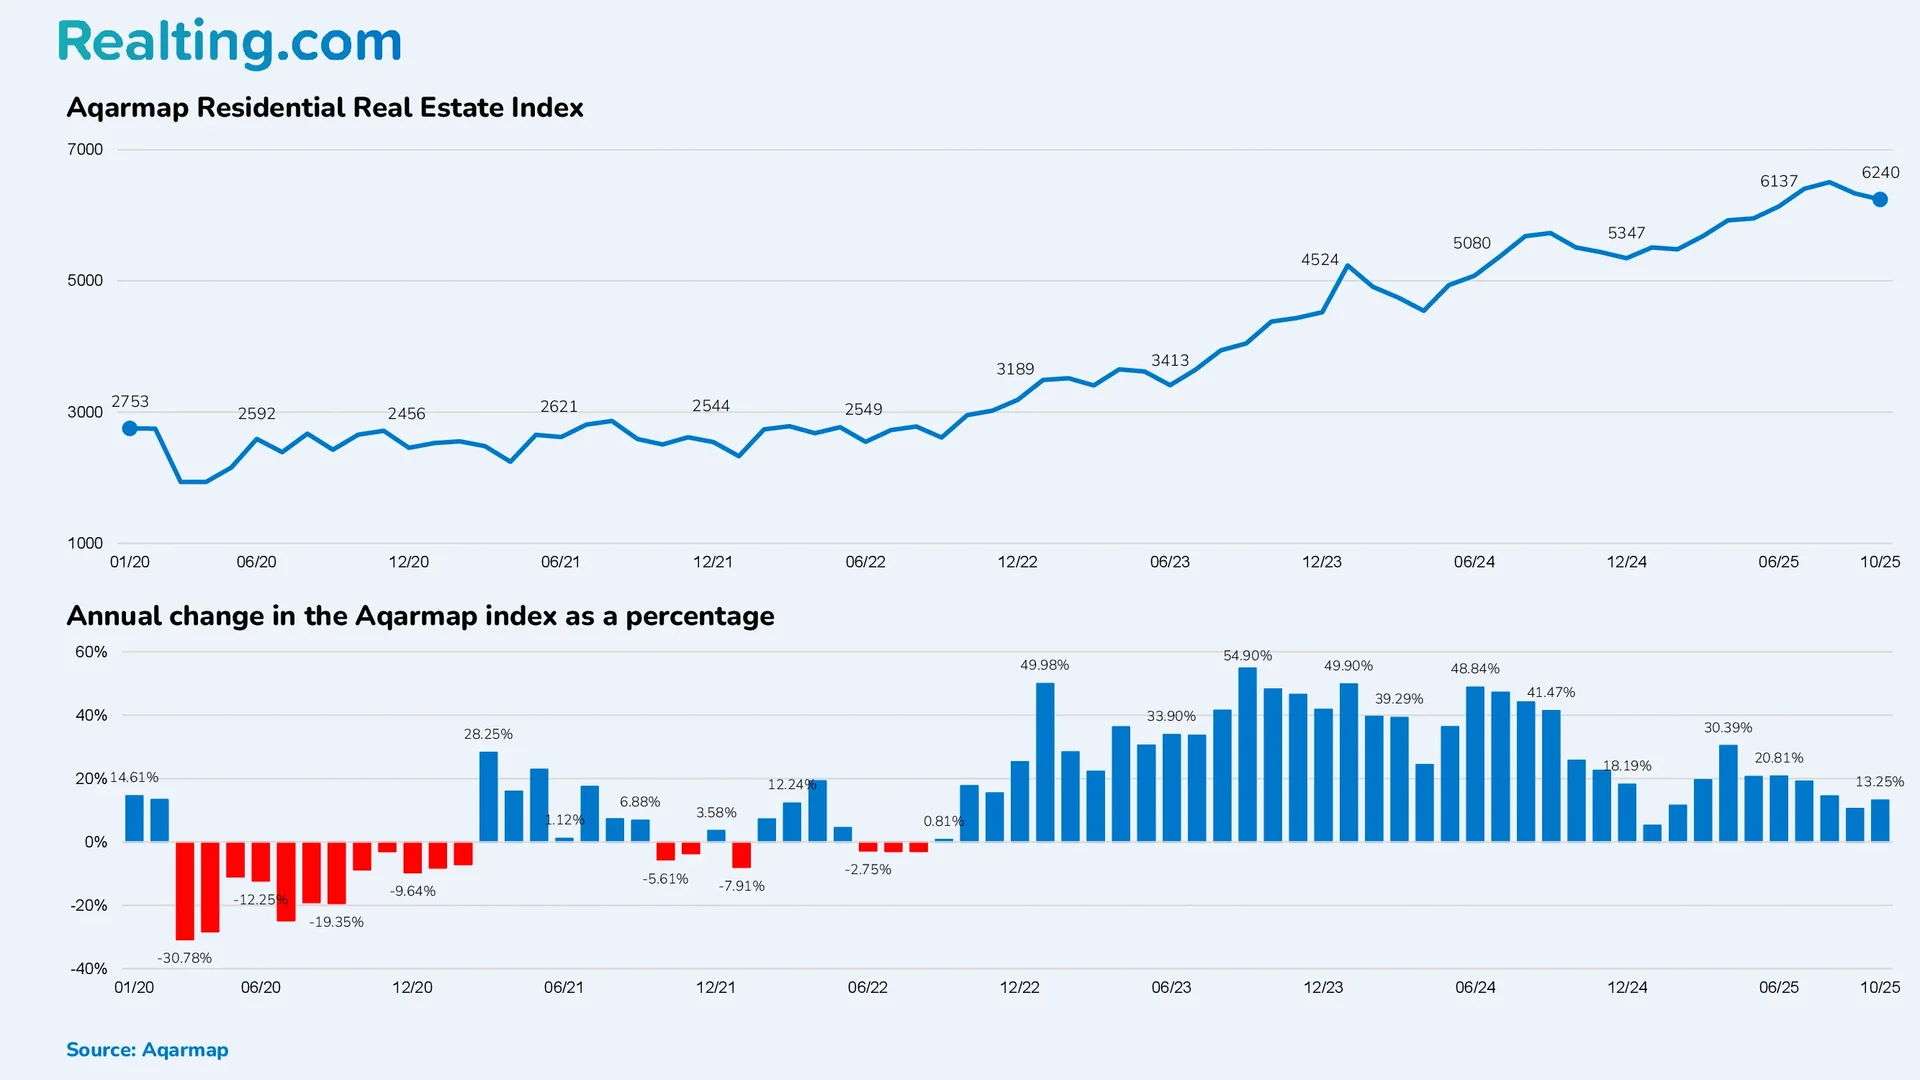
Starting from the second half of 2022, housing prices in Egypt began to grow rapidly. In some periods, the annual dynamics of the Aqarmap index exceeded +50%. Such rapid growth is explained by the strongest economic instability in the country, the highest level of inflation, and three devaluations carried out between March 2022 and March 2024.
The high level of inflation has a significant impact on the Egyptian housing market: the rapid growth of nominal prices is adjusted by the inflation rate. As an example, in April 2025 housing prices increased by 30.39% year-over-year, but the real price growth adjusted for inflation was only +14.48%. In October, with a price increase of +13.25% over the year, the real change in prices adjusted for inflation was just +0.67%.
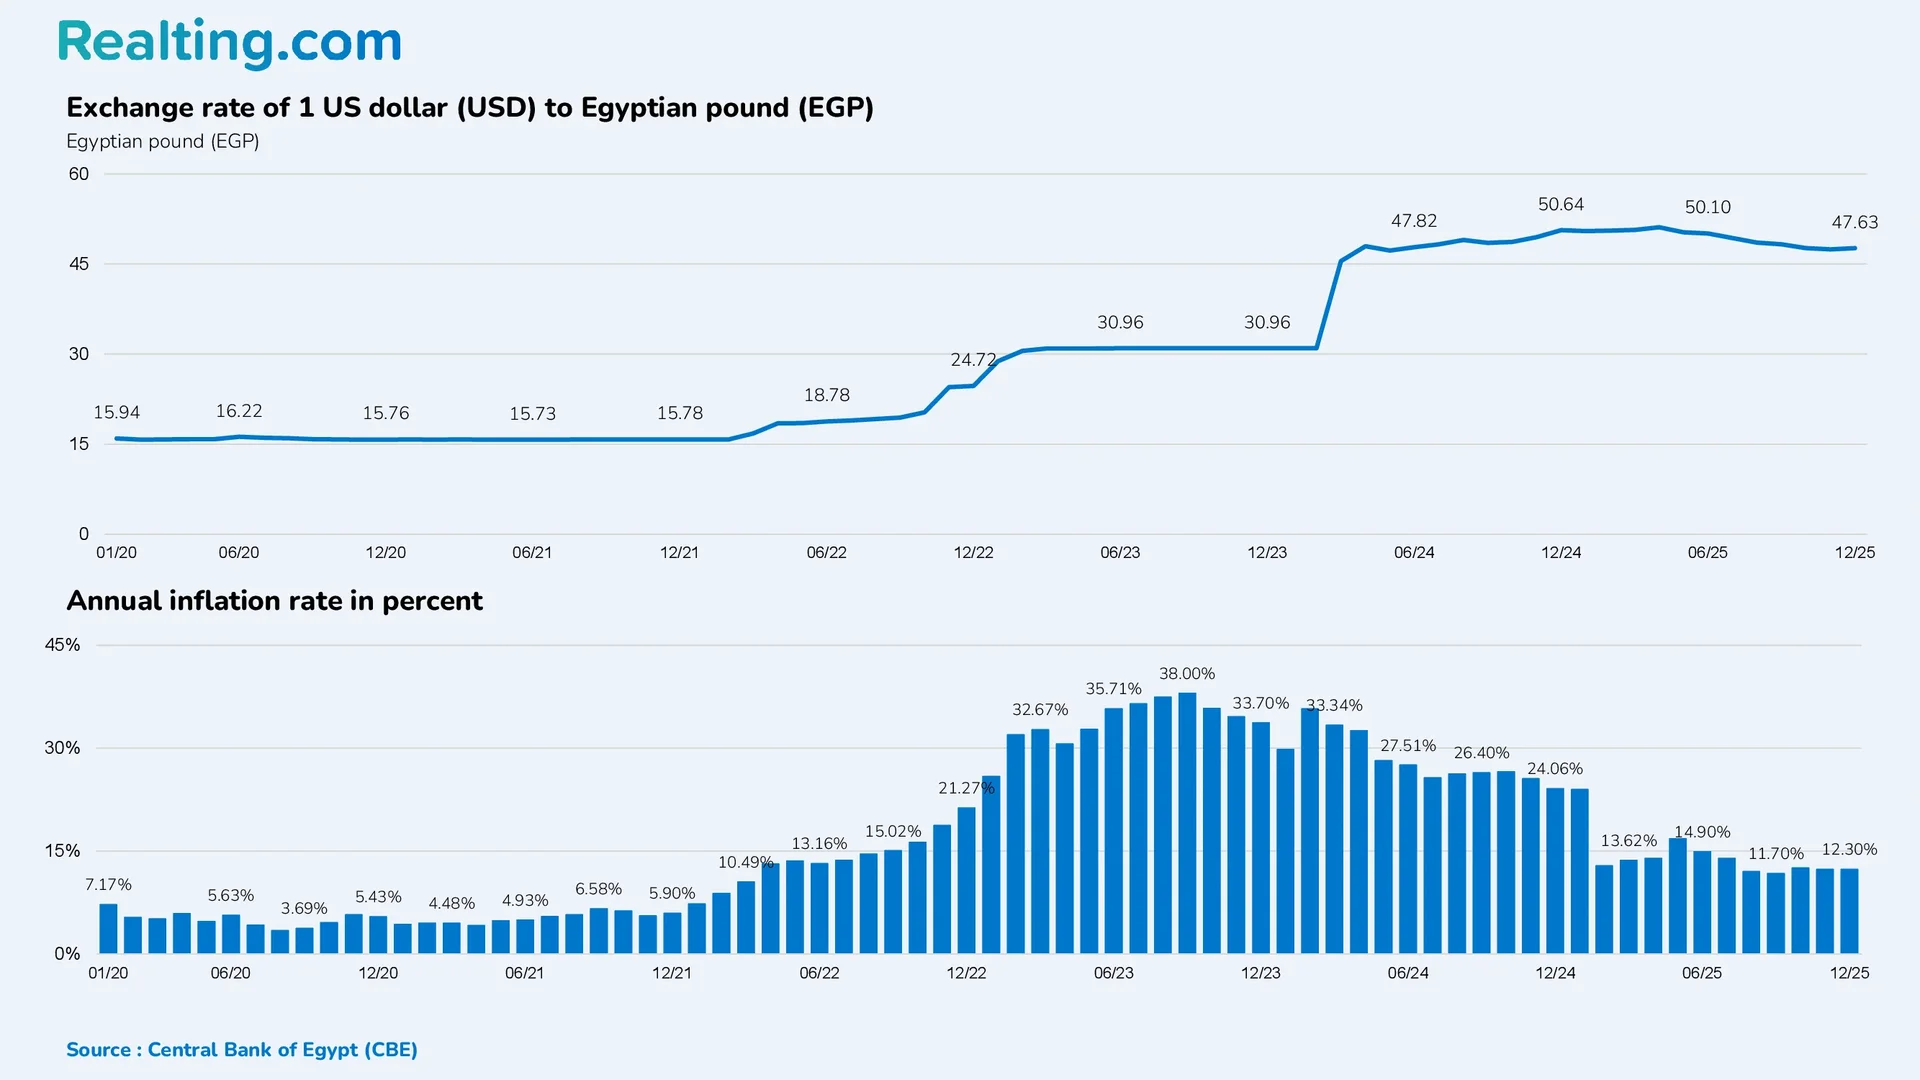
For a clearer understanding of the inflation situation in the country, below is a graph showing the change in the US dollar exchange rate against the Egyptian national currency, as well as data on the monthly dynamics of the annual inflation rate.
Below are collected data on the average purchase price of housing in Egypt’s two largest agglomerations — the Greater Cairo agglomeration and the Alexandria agglomeration, as well as the most popular regions of the country. From the data, it can be seen that most cities and districts showed outstanding nominal price growth, but in real terms, price growth was mainly observed in popular coastal locations, new cities, and suburbs.
Average price per square meter by districts, cities, and suburbs of Greater Cairo (capital region) — Egypt’s largest agglomeration
|
District or City |
Apartments, EGP/sq.m |
Change in price over 12 months |
Villas, EGP/sq.m |
Change in price over 12 months |
Apartments, USD/sq.m |
Villas, USD/sq.m |
|
El Zamalek |
64,400 |
+206.16% |
- |
- |
1350.92 |
- |
|
El Sheikh Zayed |
64,050 |
+185.83% |
72,300 |
+157.00% |
1343.58 |
1516.64 |
|
New Cairo - 5th Settlement |
61,550 |
+157.26% |
97,000 |
+287.81% |
1291.14 |
2034.77 |
|
New Heliopolis |
60,650 |
+175.10% |
- |
- |
1272.26 |
- |
|
New Administrative Capital |
51,400 |
+91.31% |
87,200 |
+275.28% |
1078.22 |
1829.20 |
|
Heliopolis - Masr El Gedida |
47,450 |
+158.65% |
- |
- |
995.36 |
- |
|
6th of October |
47,000 |
+153.71% |
74,550 |
+214.43% |
985.92 |
1563.84 |
|
Dokki |
34,400 |
+34.11% |
89,700 |
+110.68% |
721.61 |
1881.64 |
|
Manial |
33,350 |
+78.50% |
54,400 |
- |
699.58 |
1141.15 |
|
El Shorouk City |
31,800 |
+82.83% |
73,750 |
+296.70% |
667.07 |
1547.06 |
|
Garden City |
31,450 |
+17.83% |
- |
- |
659.73 |
- |
|
El Mohandeseen |
28,800 |
+23.65% |
45,550 |
- |
604.14 |
955.50 |
|
El Maadi |
26,950 |
+39.40% |
43,700 |
+93.10% |
565.33 |
916.70 |
|
Nasr City |
24,450 |
+32.70% |
45,200 |
+189.32% |
512.89 |
948.16 |
|
El Obour |
21,900 |
+39.86% |
50,100 |
+109.33% |
459.40 |
1050.95 |
|
El Agouza |
21,500 |
+20.90% |
63,100 |
- |
451.01 |
1323.65 |
|
El Nozha |
19,300 |
+59.47% |
- |
- |
404.86 |
- |
|
El Abbasiya |
19,050 |
+49.40% |
- |
- |
399.61 |
- |
|
Mokattam |
18,800 |
+24.77% |
- |
- |
394.37 |
- |
|
Downtown - West El Bald |
17,350 |
+40.12% |
- |
- |
363.95 |
- |
|
Shoubra |
16,650 |
+46.79% |
- |
- |
349.27 |
- |
|
Hadayek El Koba |
15,500 |
+42.50% |
- |
- |
325.14 |
- |
|
Hadayek El Ahram |
15,350 |
+6.05% |
17,750 |
+12.34% |
322.00 |
372.34 |
|
El Zaytun |
14,750 |
+19.74% |
47,750 |
- |
309.41 |
1001.65 |
|
El Sayyeda Zeinab |
13,150 |
+48.89% |
- |
- |
275.85 |
- |
|
Imbaba |
12,900 |
+44.30% |
- |
- |
270.60 |
- |
|
15th of May |
11,300 |
+29.13% |
34,700 |
+48.23% |
237.04 |
727.90 |
|
Ain Shams |
10,600 |
+35.90% |
29,100 |
+10.25% |
222.36 |
610.43 |
|
Helwan |
10,450 |
+34.12% |
33,050 |
+49.59% |
219.21 |
693.29 |
|
El Khalifah |
10,200 |
+52.08% |
- |
- |
213.97 |
- |
|
El Haram |
10,150 |
+10.34% |
31,700 |
+81.44% |
212.92 |
664.97 |
|
Badr City |
9950 |
+19.70% |
20,050 |
+20.48% |
208.72 |
420.59 |
|
Faisal |
9800 |
+11.48% |
27,250 |
+201.34% |
205.57 |
571.62 |
|
Giza |
9800 |
+21.91% |
50,250 |
+153.02% |
205.57 |
1054.10 |
|
El Omraneya |
9350 |
+26.24% |
- |
- |
196.14 |
- |
|
El Mataria |
8300 |
+32.59% |
- |
- |
174.11 |
- |
|
El Sharabeya |
7250 |
+35.68% |
- |
- |
152.08 |
- |
|
Madinat El Salam |
6600 |
+36.59% |
- |
- |
138.45 |
- |
|
Bashtil |
6250 |
+54.32% |
- |
- |
131.11 |
- |
|
El Basateen |
5900 |
+29.71% |
- |
- |
123.76 |
- |
|
El Marg |
4100 |
+23.49% |
- |
- |
86.01 |
- |
Average price per square meter by districts and suburbs of the Alexandria agglomeration
|
District or City |
Apartments, EGP/sq.m |
Change in price over 12 months |
Villas, EGP/sq.m |
Change in price over 12 months |
Apartments, USD/sq.m |
Villas, USD/sq.m |
|
Smouha |
45,200 |
+78.48% |
81,650 |
- |
948.16 |
1712.77 |
|
King Mariout |
40,800 |
+62.86% |
23,550 |
+57.04% |
855.86 |
494.01 |
|
Stanley |
39,950 |
+69.80% |
31,750 |
- |
838.03 |
666.02 |
|
Saba Basha |
36,550 |
+42.93% |
- |
- |
766.71 |
- |
|
Kafr Abdo |
33,450 |
+38.12% |
- |
- |
701.68 |
- |
|
San Stefano |
33,200 |
+50.51% |
- |
- |
696.44 |
- |
|
Roshdy |
31,950 |
+37.59% |
- |
- |
670.22 |
- |
|
Camp Cesar |
31,300 |
+37.73% |
- |
- |
656.58 |
- |
|
Glim |
31,050 |
+34.27% |
- |
- |
651.34 |
- |
|
El Chatby |
30,750 |
+19.99% |
- |
- |
645.04 |
- |
|
Lauran |
30,150 |
+24.93% |
43,500 |
- |
632.46 |
912.50 |
|
Sporting |
29,650 |
+28.02% |
- |
- |
621.97 |
- |
|
Mahta El Raml |
28,550 |
+84.98% |
- |
- |
598.89 |
- |
|
Cleopatra |
28,100 |
+32.77% |
- |
- |
589.45 |
- |
|
Ibrahimia |
27,850 |
+26.20% |
- |
- |
584.21 |
- |
|
Sidi Gaber |
27,700 |
+34.87% |
- |
- |
581.06 |
- |
|
Zezenia |
24,800 |
+33.60% |
- |
- |
520.23 |
- |
|
Bolekly |
22,650 |
+14.93% |
63,800 |
- |
475.13 |
1338.33 |
|
Borg El Arab |
20,350 |
+51.96% |
20,950 |
+51.06% |
426.88 |
439.47 |
|
Ganaklis |
20,350 |
+18.27% |
- |
- |
426.88 |
- |
|
Miami |
19,950 |
+20.79% |
- |
- |
418.49 |
- |
|
El Montazah |
19,200 |
+16.24% |
- |
- |
402.76 |
- |
|
Fleming |
19,100 |
+17.86% |
58,600 |
- |
400.66 |
1229.25 |
|
Sidi Bishr |
17,600 |
+28.61% |
- |
- |
369.20 |
- |
|
Moharram Bey |
16,950 |
+28.66% |
71,350 |
- |
355.56 |
1496.71 |
|
El Asafra |
15,600 |
+22.77% |
- |
- |
327.24 |
- |
|
El Mandara |
15,150 |
+40.31% |
- |
- |
317.80 |
- |
|
Victoria |
14,150 |
+24.75% |
- |
- |
296.82 |
- |
|
Mansheya |
12,550 |
+37.08% |
- |
- |
263.26 |
- |
|
El Mamoura |
12,400 |
+26.39% |
55,550 |
+111.12% |
260.12 |
1165.27 |
|
Bakoos |
10,700 |
+66.00% |
- |
- |
224.45 |
- |
|
New Miami |
10,500 |
+13.25% |
- |
- |
220.26 |
- |
|
Abo Qir |
10,050 |
+36.95% |
- |
- |
210.82 |
- |
|
El Seyouf |
8900 |
+23.38% |
- |
- |
186.70 |
- |
|
El Hadara |
8050 |
+26.18% |
- |
- |
168.87 |
- |
|
Abu Talat |
5150 |
+9.32% |
8050 |
-10.45% |
108.03 |
168.87 |
|
El Amreya |
4100 |
+7.05% |
47,700 |
+267.91% |
86.01 |
1000.60 |
Average price per square meter in other cities of Egypt in the most popular regions
|
District or City |
Apartments, EGP/sq.m |
Change in price over 12 months |
Villas, EGP/sq.m |
Change in price over 12 months |
Apartments, USD/sq.m |
Villas, USD/sq.m |
|
North Coast |
||||||
|
El Alamein |
56,000 |
+190.21% |
83,150 |
+269.14% |
1174.71 |
1744.24 |
|
New Alamein |
55,300 |
+98.62% |
85,700 |
- |
1160.03 |
1797.73 |
|
Ain El Sokhna |
||||||
|
Ain Sokhna Resorts |
90,950 |
+270.07% |
- |
- |
1907.86 |
- |
|
New Galala City |
92,550 |
- |
64,750 |
- |
1941.42 |
1358.26 |
|
Ain El Sokhna - Zafarana Rd |
44,550 |
- |
84,400 |
+244.39% |
934.53 |
1770.46 |
|
Dakahlia |
||||||
|
Mansoura |
18,000 |
+23.19% |
27,900 |
+12.22% |
377.59 |
585.26 |
|
New Mansoura City |
43,600 |
+55.12% |
28,500 |
+12.51% |
914.60 |
597.85 |
|
Gharbia |
||||||
|
Tanta |
16,900 |
+24.75% |
27,600 |
- |
354.51 |
578.97 |
|
El Mahallah El Kubra |
11,200 |
+37.42% |
19,700 |
- |
234.94 |
413.25 |
|
Qalyubia |
||||||
|
Banha City |
19,650 |
+15.80% |
- |
- |
412.20 |
- |
|
Qlioub |
6700 |
+31.30% |
10,700 |
- |
140.55 |
224.45 |
The Egyptian housing market has proven that even under conditions of unstable economic situation in the country, it is capable of remaining resilient and showing growth. As the economic situation in the country gradually improves, the housing market will become an increasingly attractive asset for investors.
Probably the most important factor supporting demand at a high level is the country’s demographic growth, which increases the need for housing. Another factor is the development of new cities such as New Administrative Capital, New El Alamein, New Cairo, 6th of October City, New Mansoura, which are designed to meet increased demand, stimulate the local construction and banking sectors, and become new centers for attracting investment.