Turkish Housing Market 2025: 25% Sales Growth and Prices by Region
Before talking about the results of the Turkish housing market this year, it is worth mentioning that after a noticeable drop in housing sales in 2023, the number of housing transactions increased by 20.6% in 2024 compared to the previous year. The total number of housing purchase and sale transactions for 2024 amounted to almost 1.48 million transactions — this is the data provided by the Turkish Statistical Institute. In terms of the number of housing purchase and sale transactions, 2024 is only slightly inferior to the record-breaking 2020-2022.
Number and Structure of Purchase and Sale Transactions
Despite the ongoing economic problems, the highest level of inflation, the consequences of the catastrophic earthquake in early 2023, the Turkish housing market in 2024 showed a high level of demand and activity, thereby demonstrating its ability to quickly recover.
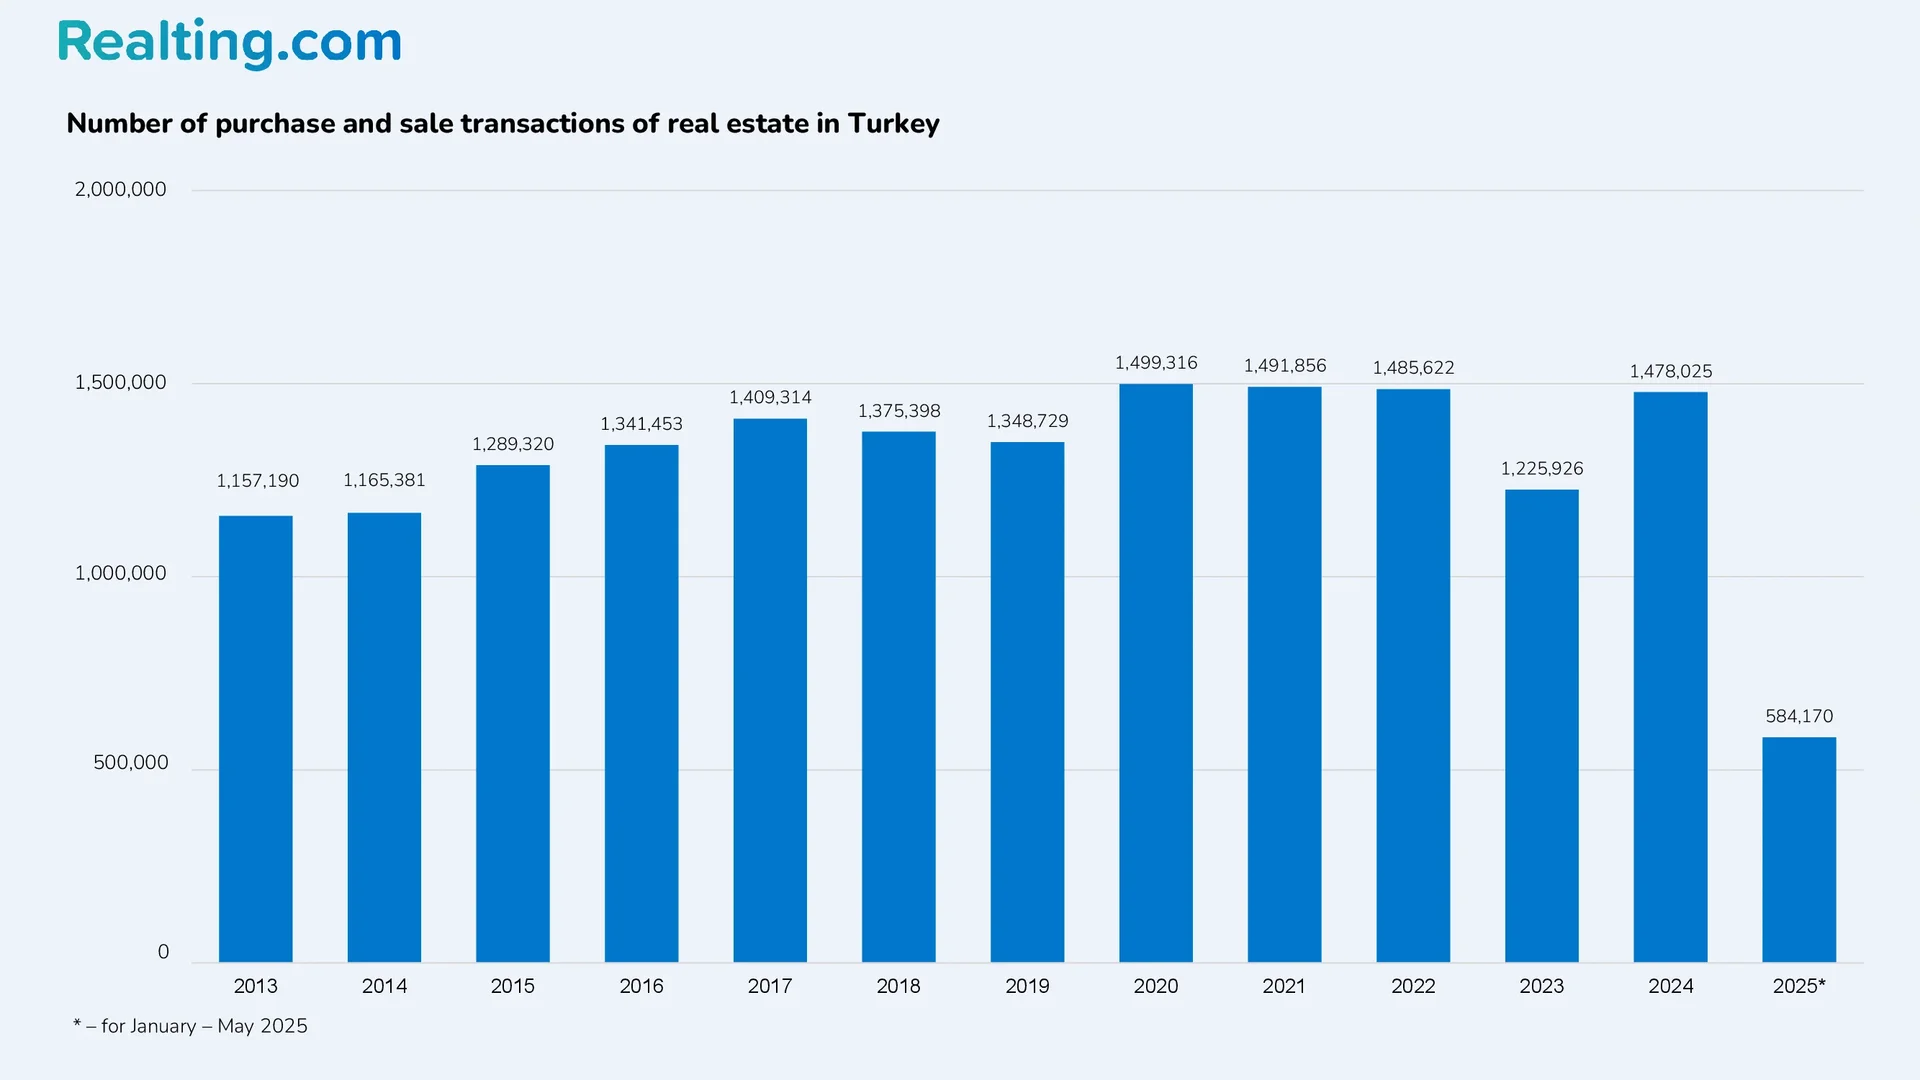
The year 2025 has started off quite briskly for the Turkish residential real estate market: if in 2024 the average monthly number of housing transactions from January to May was just over 93 thousand, then in 2025 the average monthly number of housing transactions for January-May was almost 117 thousand purchase and sale transactions. According to the Turkish Statistical Institute, a total of 584,170 residential real estate purchase and sale transactions were registered in Turkey from January to May 2025, which is 25.4% more than in the same period in 2024, when 465,761 housing transactions were registered.
About 45% of all sales and purchase transactions in the country in January-May 2025 were registered in 6 provinces of Turkey (there are 81 provinces in the country in total). These provinces have the largest population and are also the most economically developed. Thus, 98,827 transactions were registered in Istanbul Province, 54,016 transactions in Ankara, 36,877 in Izmir, 31,954 in Antalya, 20,058 in Bursa, and 20,054 in Mersin.
From 2020 to 2023, the share of the primary market in sales and purchase transactions in Turkey was 31%, while in 2024, the share of the primary market increased by 2 percentage points and amounted to 33%.
Between January and May 2025, 174,055 purchase and sale transactions were completed in the primary real estate market in Turkey, accounting for 30% of all housing transactions during this period.
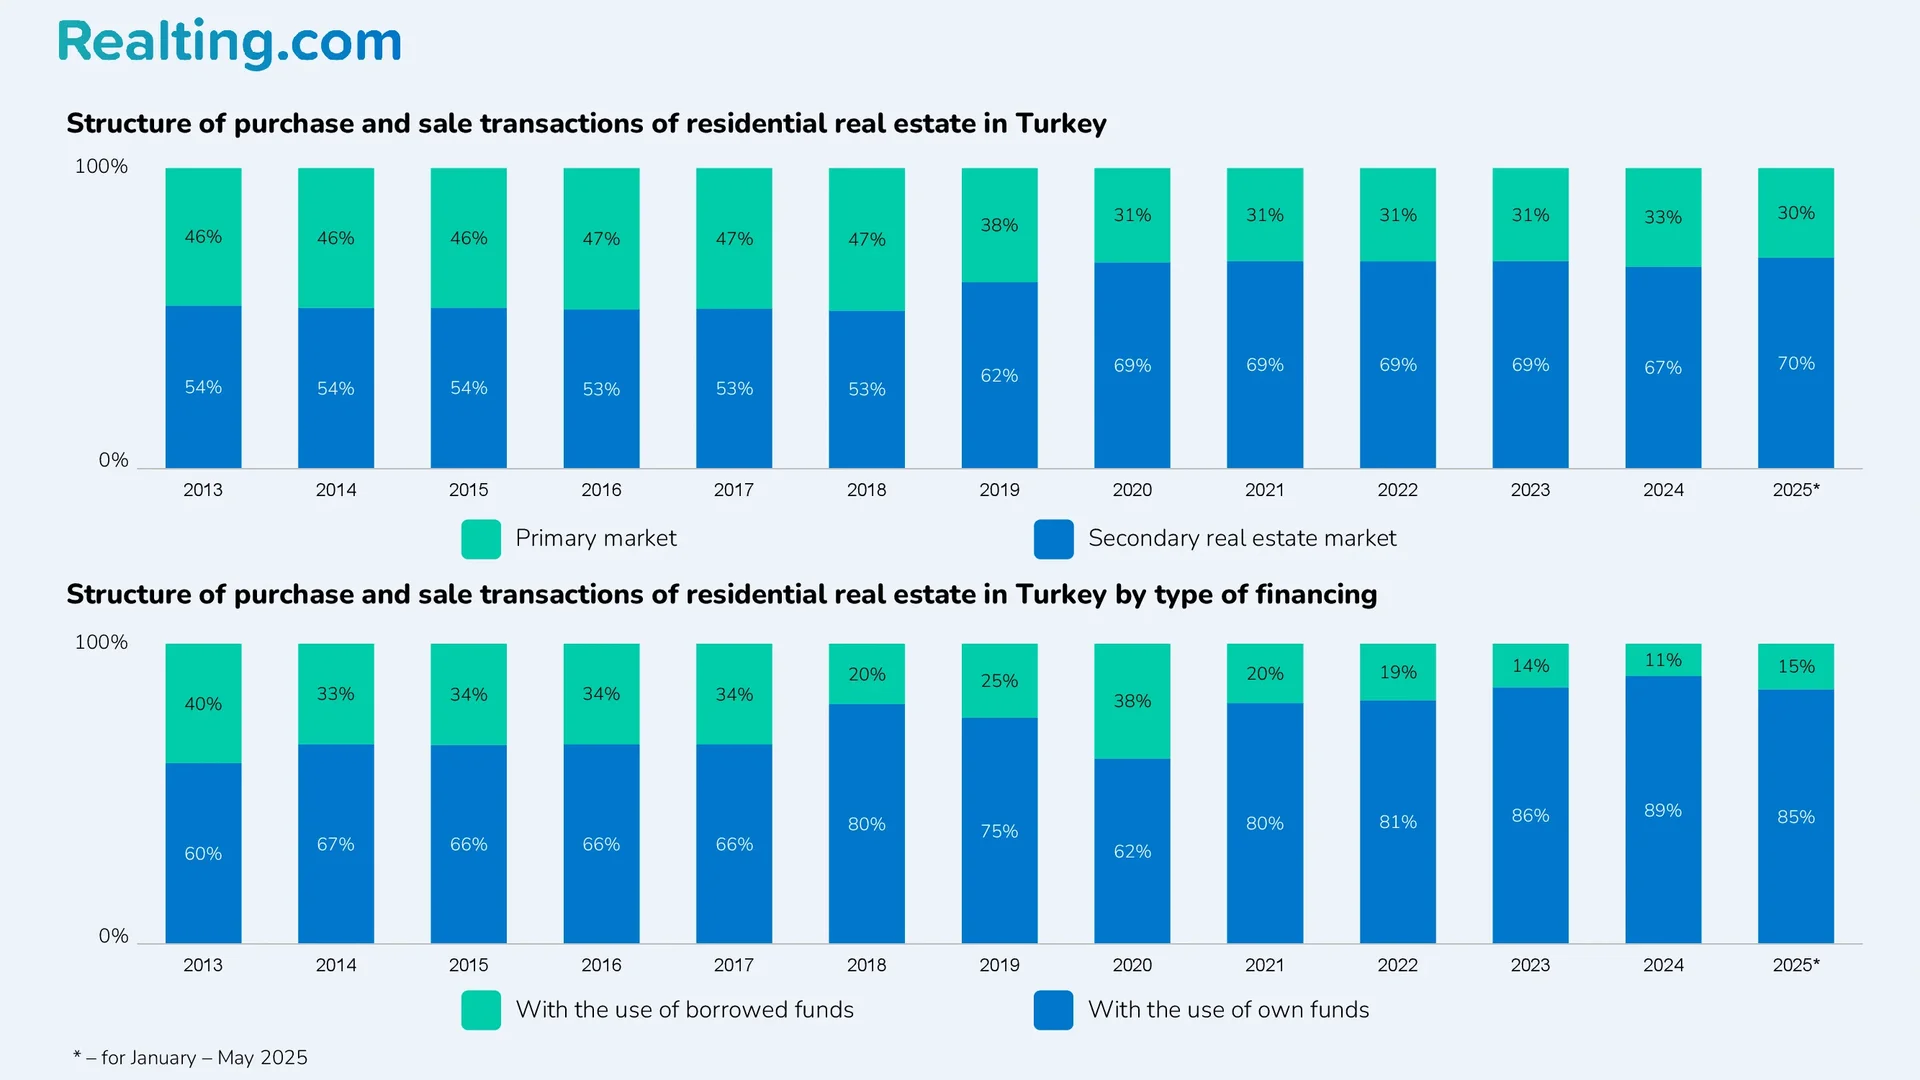
Since 2021, there has been a decrease in residential real estate transactions in Turkey using borrowed funds, both in relative and absolute terms. Thus, if in 2020 the share of transactions using borrowed funds was 38% (573.3 thousand transactions), then by the end of 2024, only 11% (158.5 thousand) of transactions were made using a loan to purchase a home. In the first five months of 2025, 88,606 purchase and sale transactions using borrowed funds were registered on the Turkish housing market, which is almost 2 times more than in the first five months of 2024. If in January-May 2024 the share of transactions using borrowed funds was 10%, then already in January-May 2025 the share of such transactions was 15%.
Who Bought Housing in Turkey in 2024, and Who is Buying in 2025?
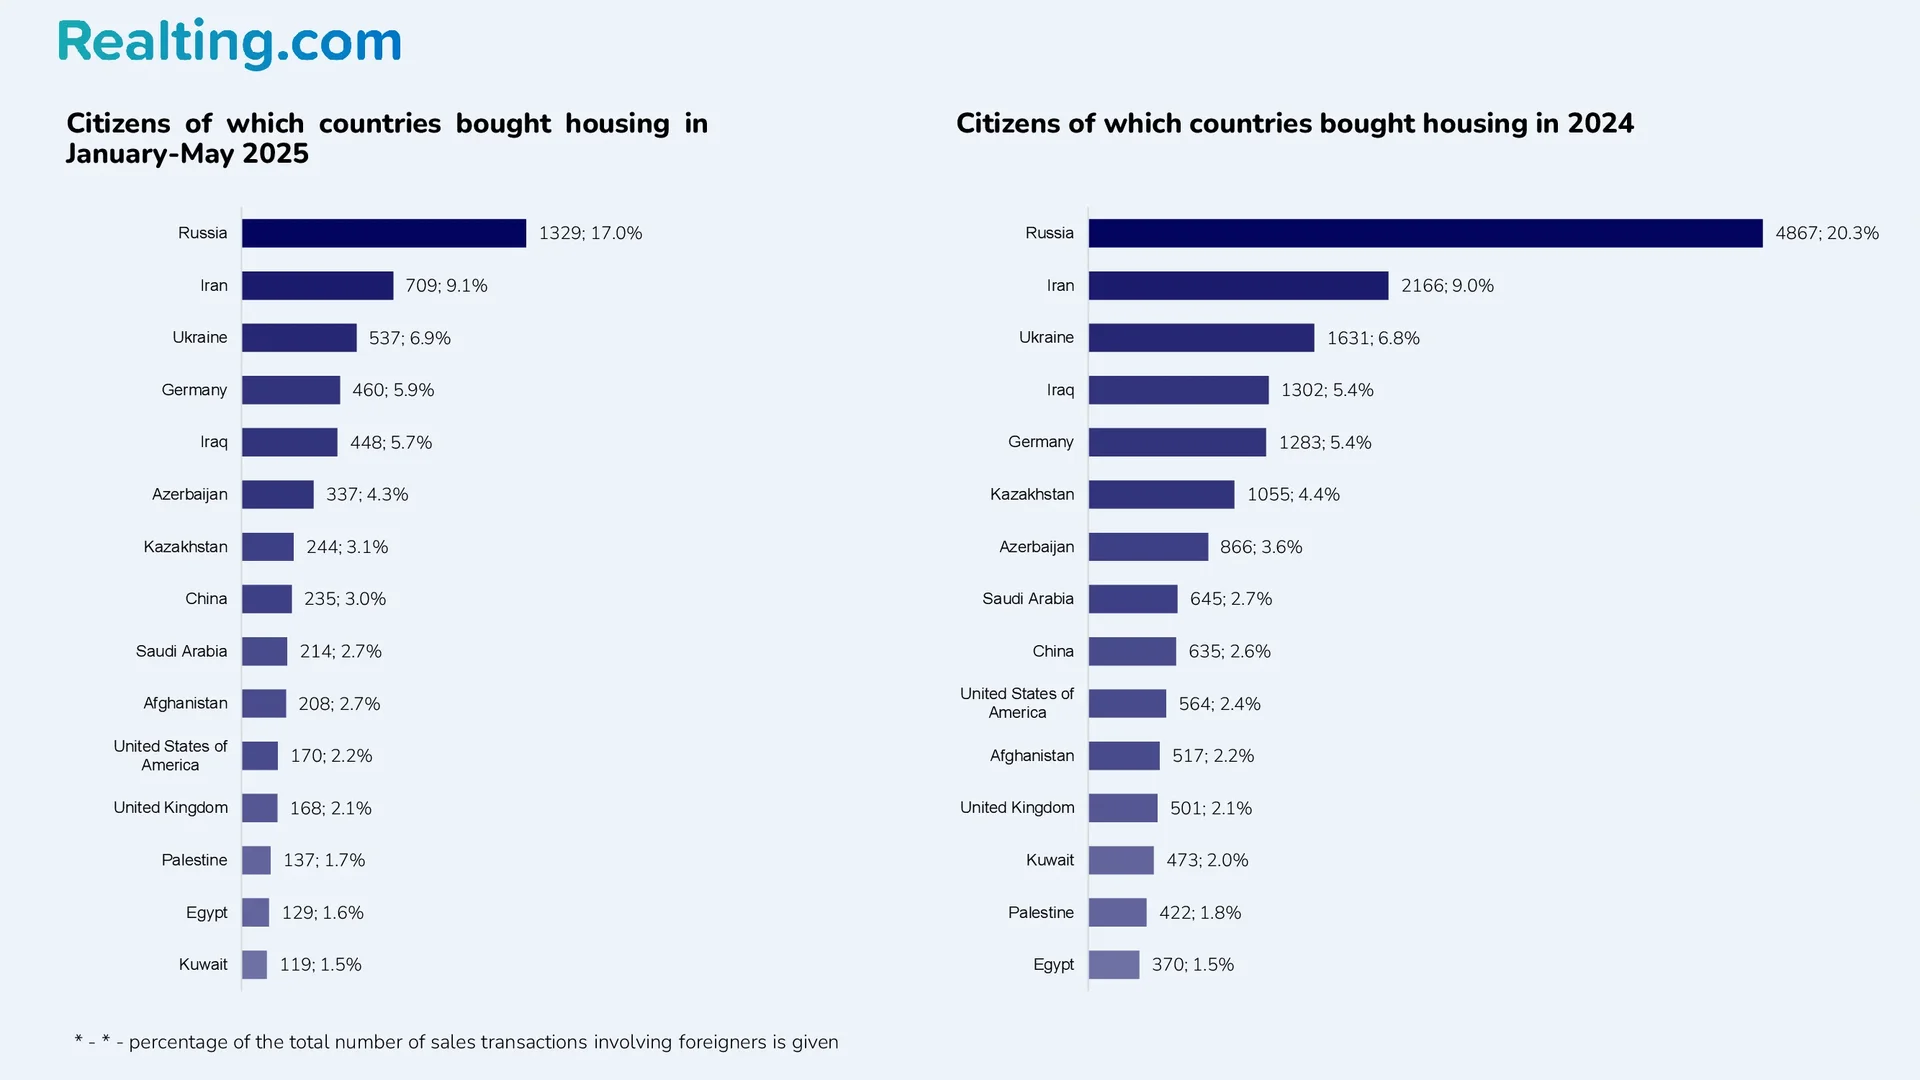
Although housing sales in Turkey increased significantly in 2024 compared to the previous year, housing sales to foreign nationals decreased by 32%. A total of 23,781 residential properties were sold to foreign nationals in 2024. In total, foreigners purchased 7,789 housing units from January to May 2025, which is 13.7% less than in the same period in 2024.
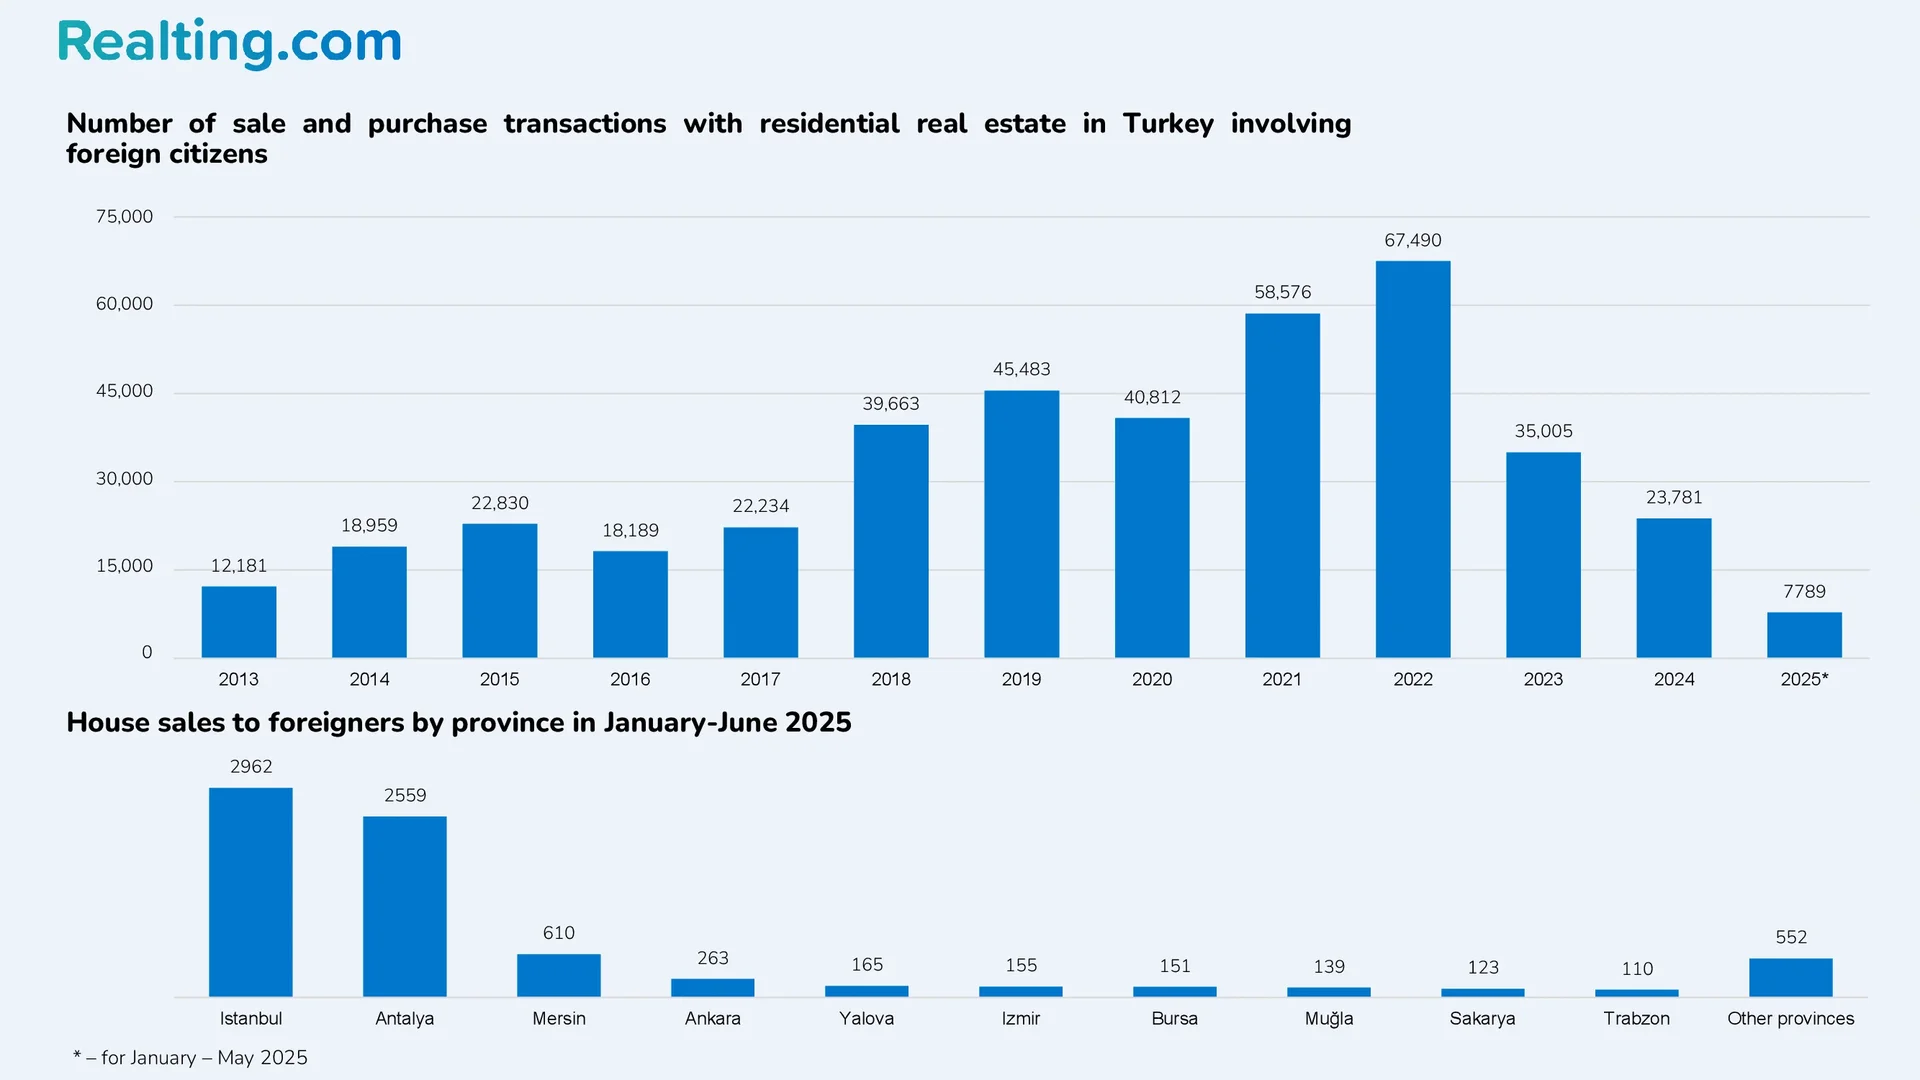
Most often in January-May 2025, foreigners bought housing in the provinces of Istanbul and Antalya. In total, 5,521 residential properties were sold in these two provinces, which is 70.9% of all housing sales to foreigners.
Data from the Turkish Statistical Institute show that in the period from January to May 2025, the largest number of housing sales to foreign citizens were to holders of Russian passports. Traditionally, in addition to Russian citizens, the leaders in purchasing housing among foreign citizens in Turkey are citizens of Iran, Ukraine, Germany, Iraq, and Azerbaijan.
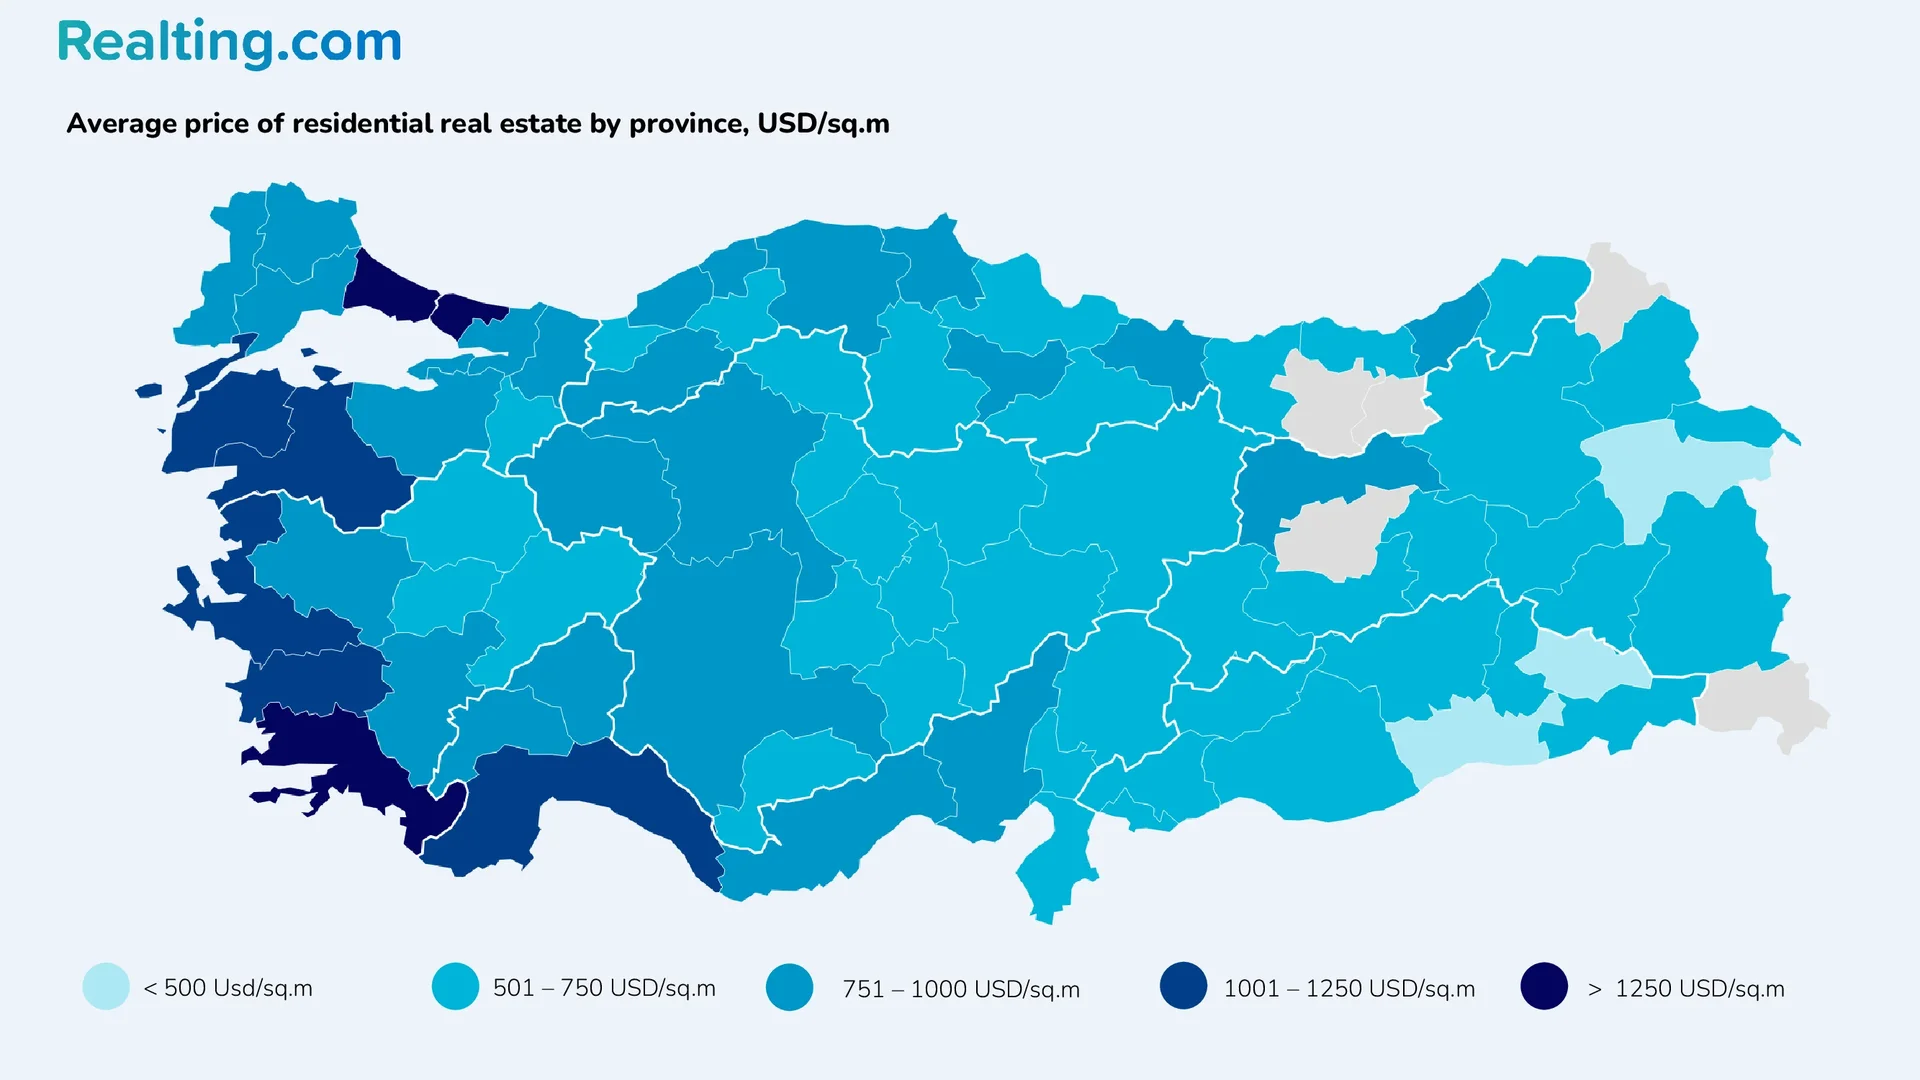
Housing Prices in Different Provinces of Turkey
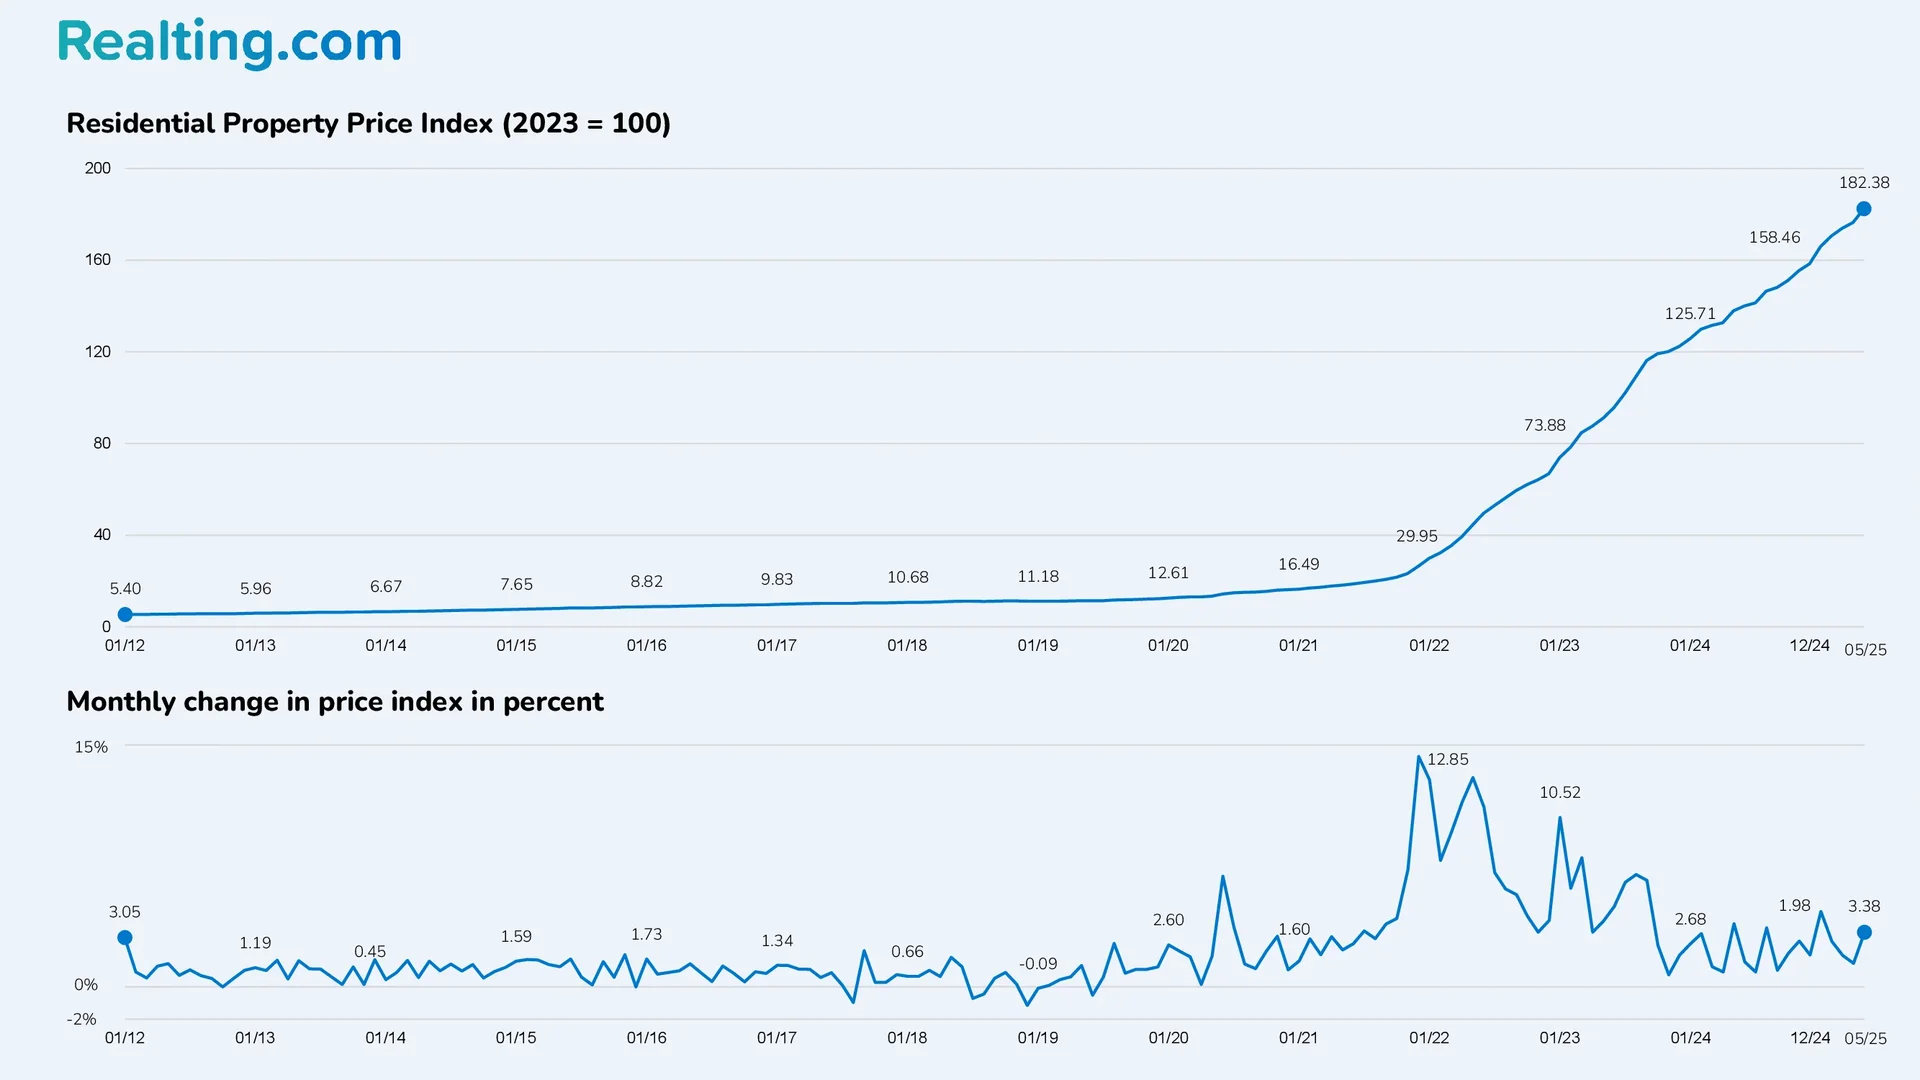
According to the Central Bank of Turkey, the residential property price index (2023 = 100) in May 2025 was 182.38 points, which is 32.3% more than in May last year.
Currently, the Central Bank of Turkey provides data on the average housing prices in the provinces of Turkey for the first quarter of 2025. Below is data on how housing prices changed in Turkish lira and US dollars in the 6 most popular provinces of Turkey.
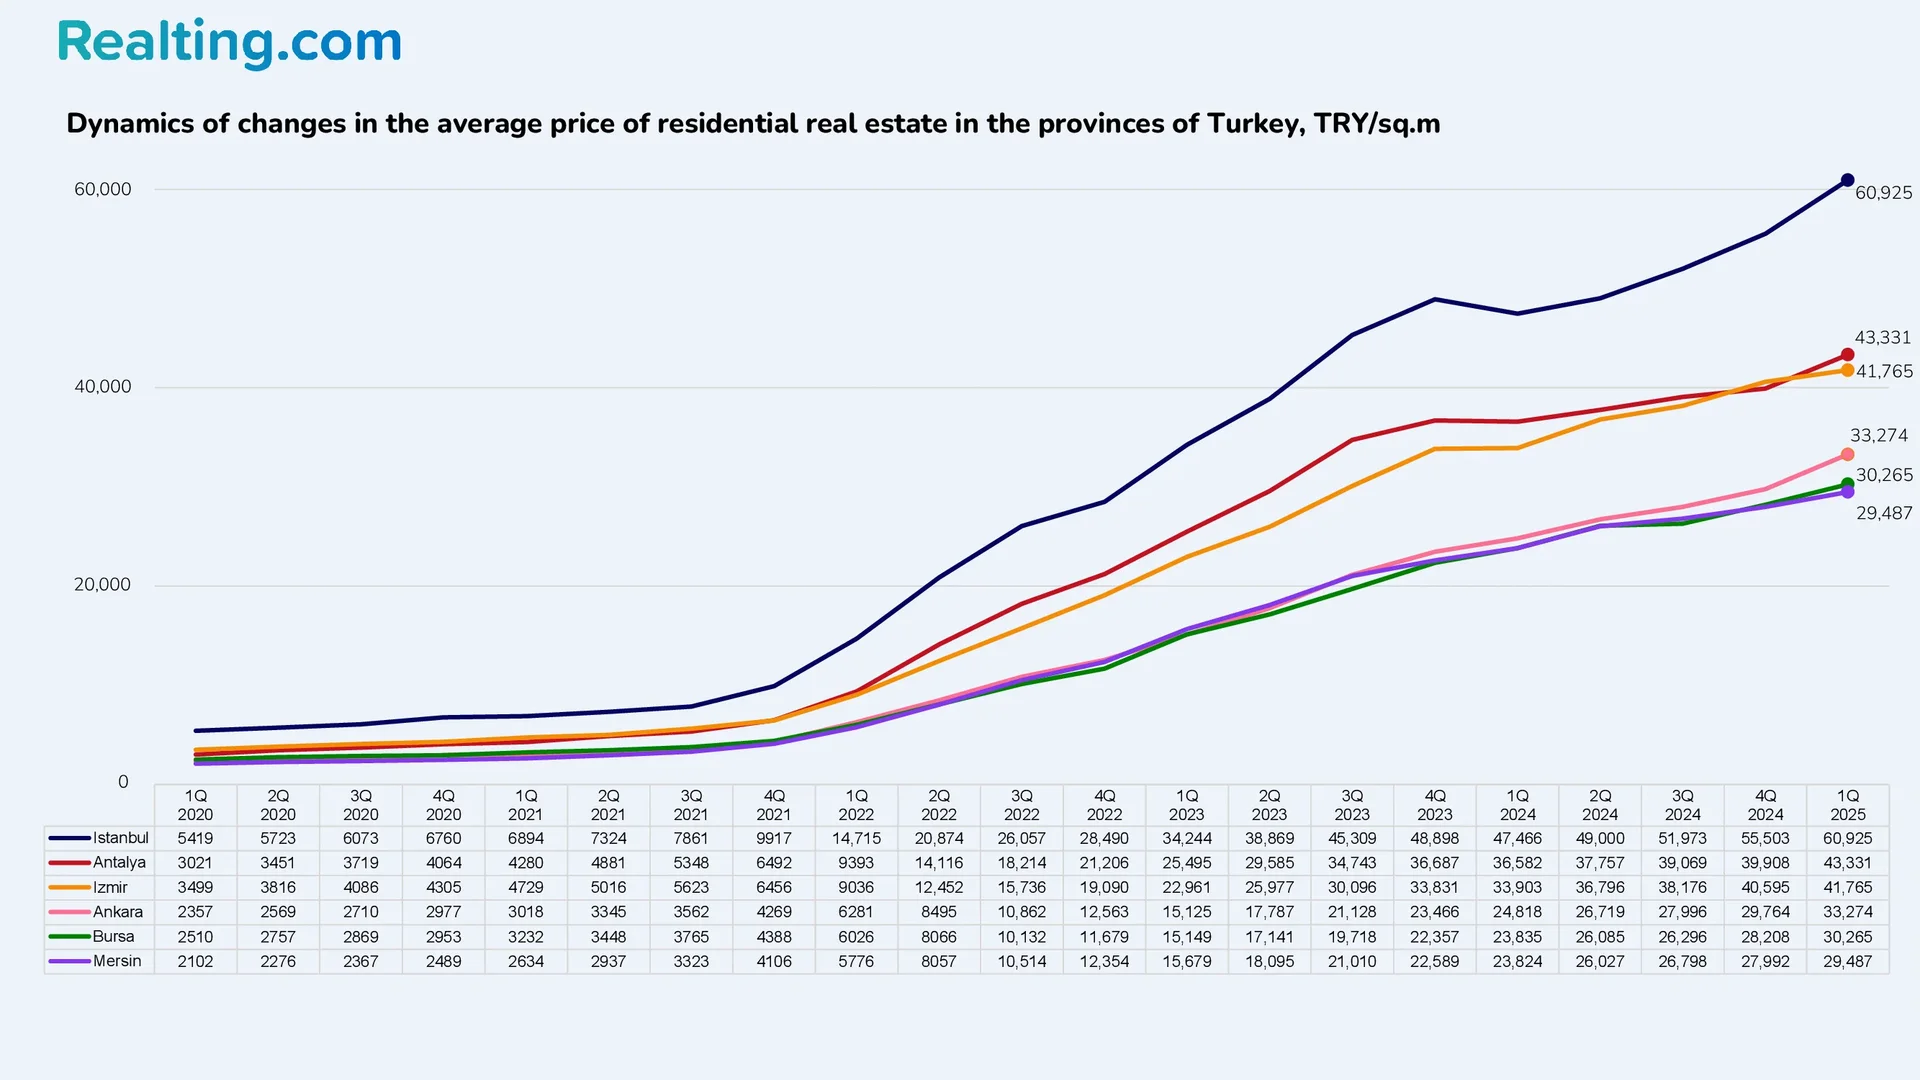
Average price per square meter in Turkish lira:
|
City |
Average price, TRY/sq.m |
Change by Q4 2024 |
Change by Q1 2024 |
|
Istanbul |
60,925 |
+9.8% |
+28.4% |
|
Antalya |
43,331 |
+8.6% |
+18.4% |
|
Izmir |
41,765 |
+2.9% |
+23.2% |
|
Ankara |
33,274 |
+11.8% |
+34.1% |
|
Bursa |
30,265 |
+7.3% |
+27.0% |
|
Mersin |
29,487 |
+5.3% |
+23.8% |
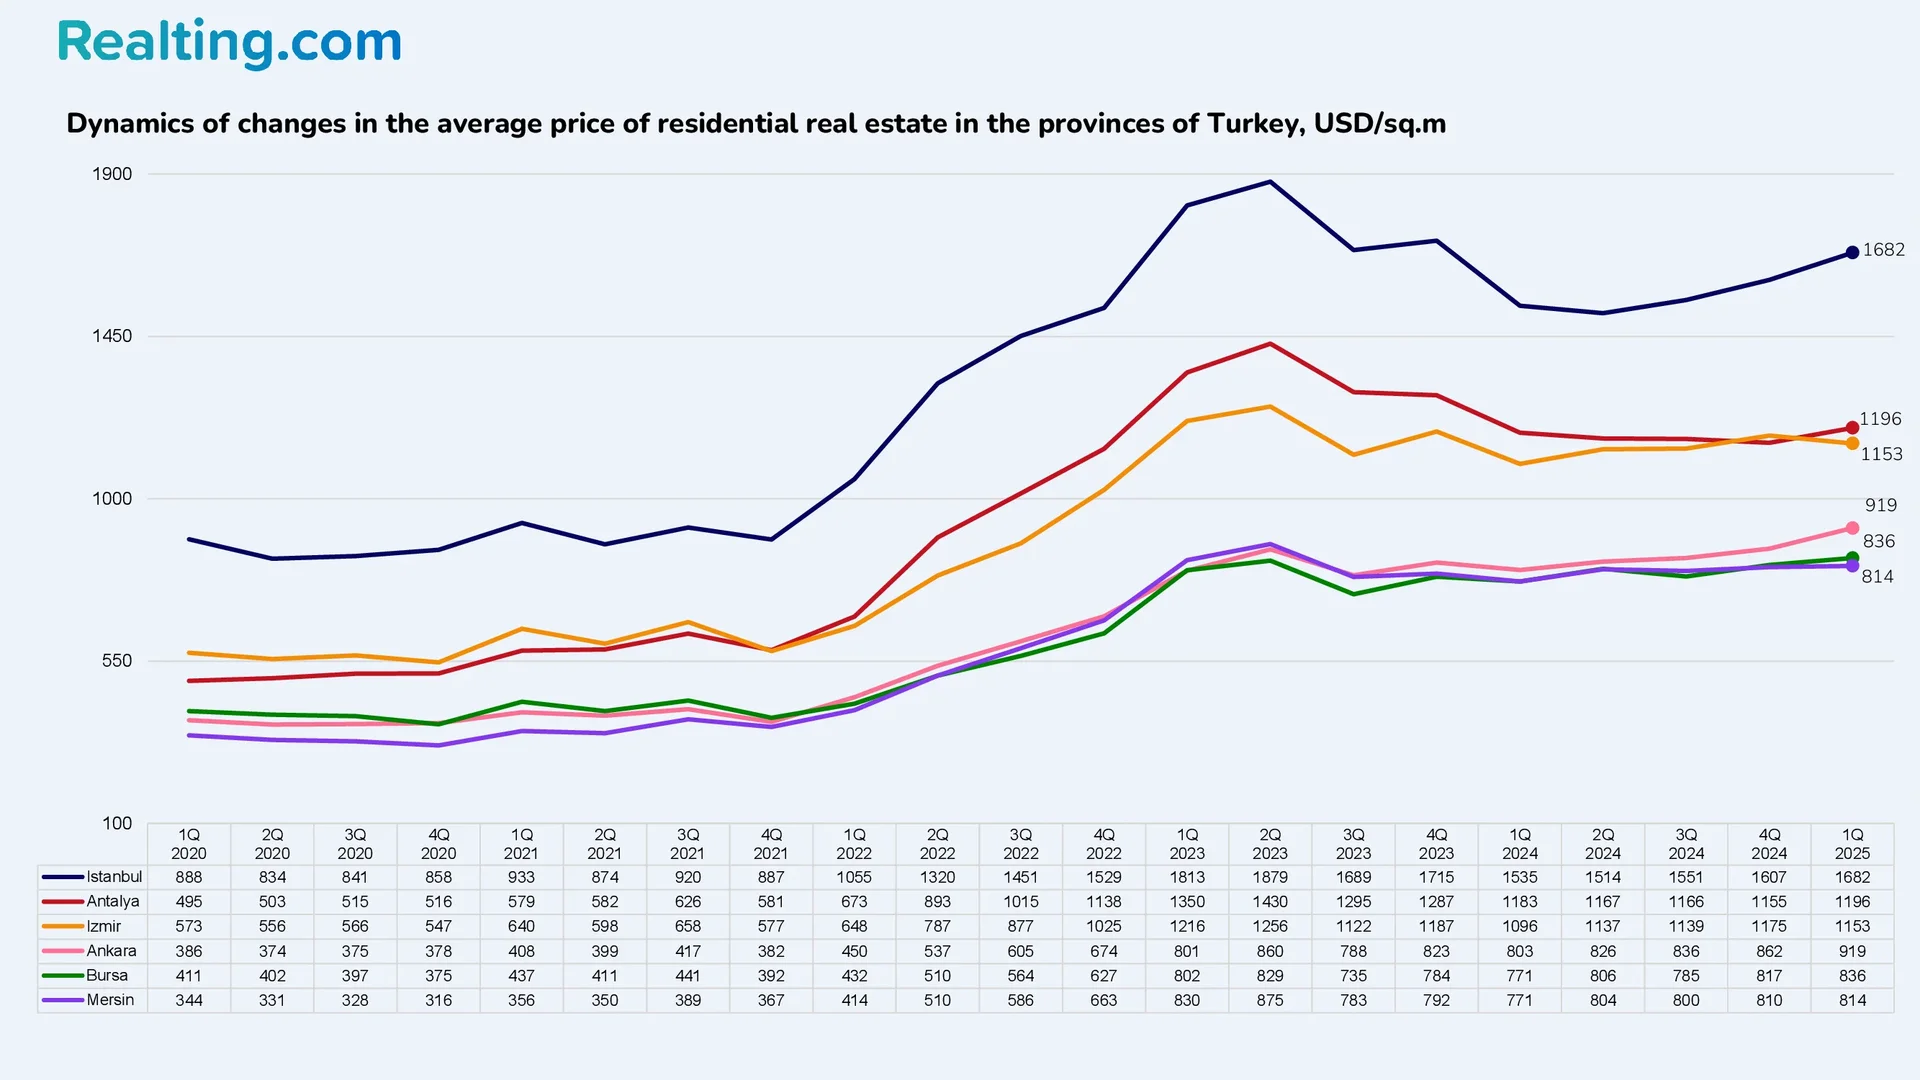
Average price per square meter in the USA dollar:
|
City |
Average price, USD/sq. m. |
Change by Q4 2024 |
Change by Q1 2024 |
|
Istanbul |
1682 |
+4.7% |
+9.6% |
|
Antalya |
1196 |
+3.6% |
+1.1% |
|
Izmir |
1153 |
-1.9% |
+5.2% |
|
Ankara |
919 |
+6.6% |
+14.5% |
|
Bursa |
836 |
+2.3% |
+8.4% |
|
Mersin |
814 |
+0.5% |
+5.7% |
In Q1 2025, 76 provinces in Turkey showed an annual increase in prices in national currency, while there is no data on the change in average housing prices for another 5 provinces. It is worth noting that in 14 out of 81 provinces, prices increased by more than 40% over the year.
If we talk about prices in dollar terms, the situation is similar. Over the year, prices increased in 75 provinces. However, in the province of Mugla, the average housing price decreased by 8%. It is worth noting that the province of Mugla is the province with the most expensive average price per square meter in Turkey, and in Q1 2025, the average price per square meter here was 65,547 TRY / sq.m (1838 USD / sq.m).
We would like to mention the province of Istanbul, which is located at the junction of two parts of the world – Europe and Asia – and is divided by the Bosphorus Strait into the European and Asian parts. The province of Istanbul includes 39 ilçe (or municipal districts). The cost of housing can vary significantly depending on the district. The districts with the most expensive square meter are located in the central part of the province of Istanbul – along the Bosphorus Strait. In turn, the further from the strait to the east or west, the cheaper the cost of a square meter of housing becomes.
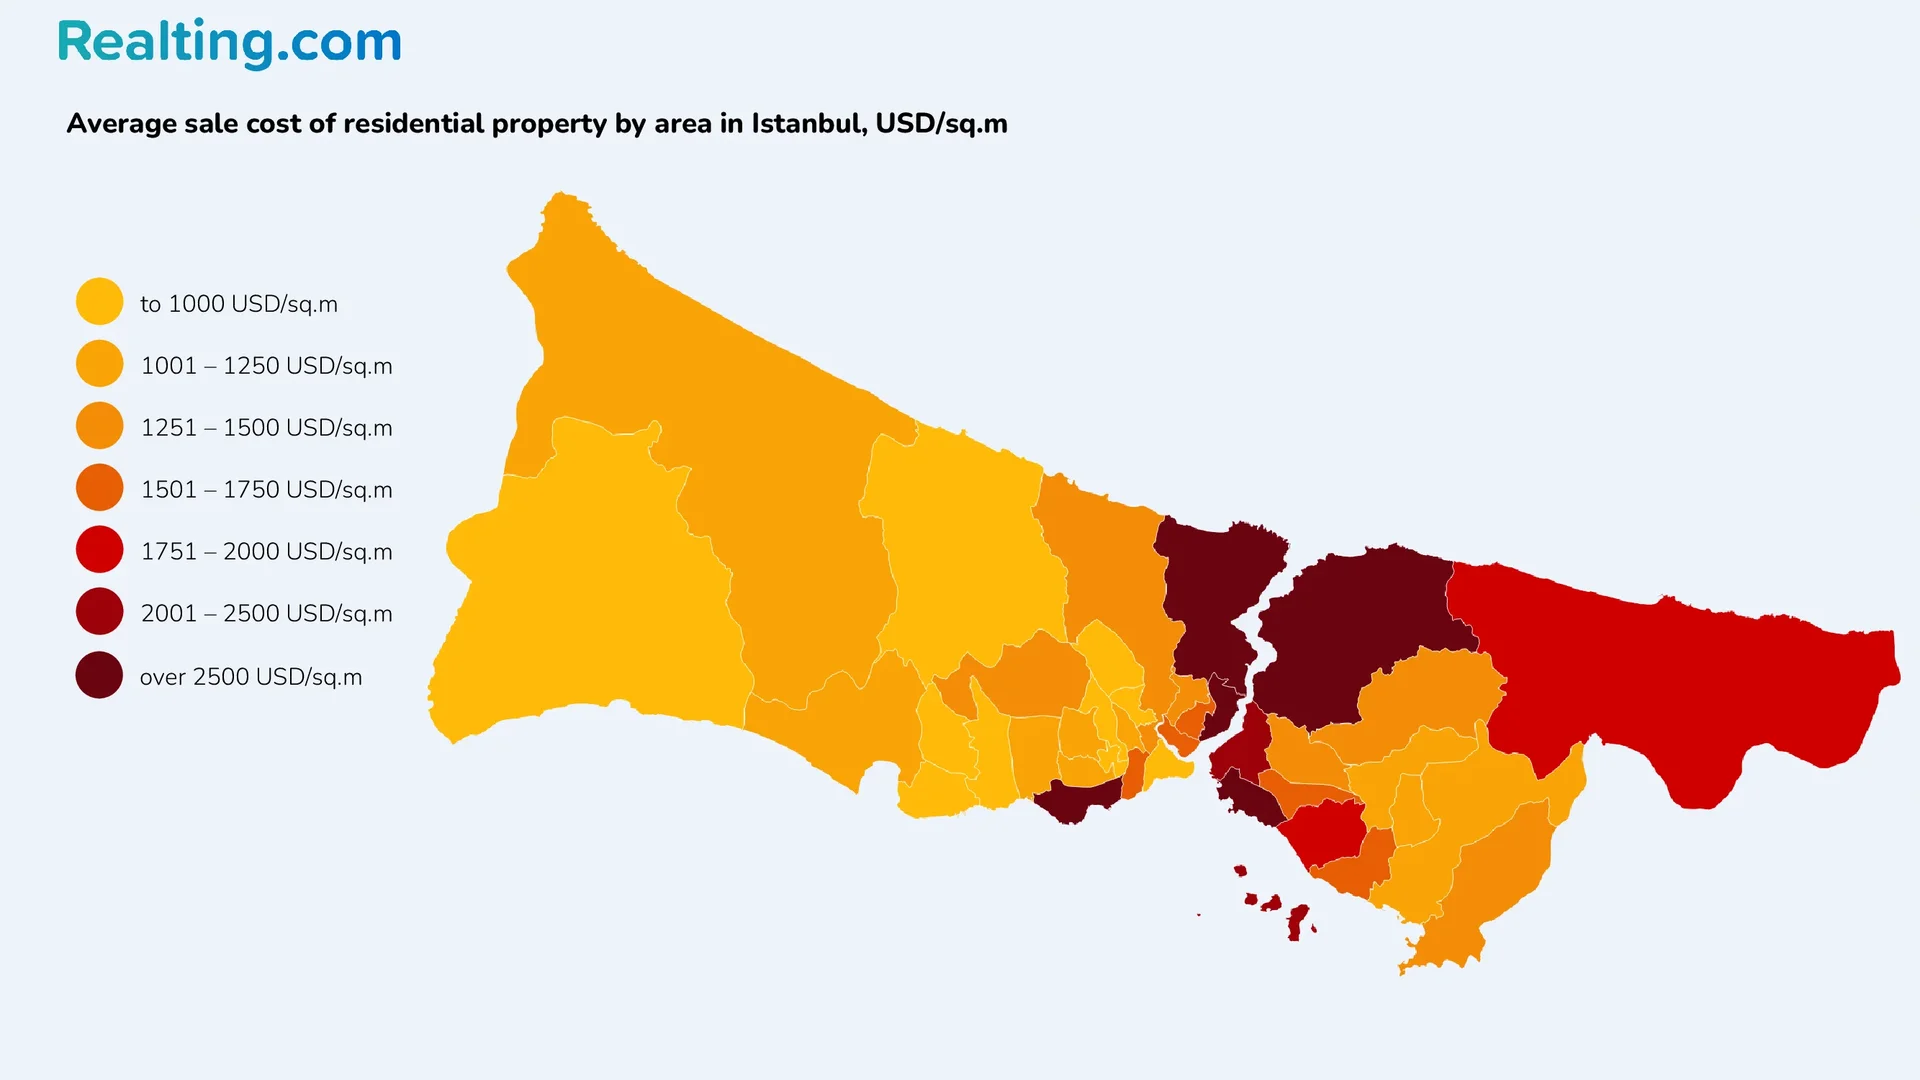
According to Endeksa, the most expensive areas in Istanbul for buying a home in June 2025 were Beşiktaş, Sarıyer, Kadıköy, Beykoz, Bakırköy. In turn, the most affordable housing is in the areas of Esenyurt, Sultangazi, Güngören, Arnavutköy, Avcılar.
Top 5 most expensive areas of Istanbul in June 2025:
|
District |
Average sales price, USD/sq.m |
Annual change in value |
|
Beşiktaş |
3548 |
+2.5% |
|
Sarıyer |
3482 |
-2.3% |
|
Kadıköy |
3429 |
+21.0% |
|
Beykoz |
2679 |
-5.2% |
|
Bakırköy |
2561 |
+6.1% |
Top 5 cheapest areas of Istanbul in June 2025:
|
District |
Average sales price, USD/sq.m |
Annual change in value |
|
Esenyurt |
657 |
+12.9% |
|
Sultangazi |
849 |
+3.7% |
|
Güngören |
867 |
+3.2% |
|
Arnavutköy |
877 |
+3.5% |
|
Avcılar |
932 |
-1.2% |
FAQ About the Turkish Real Estate Market in 2025
How much does a square meter of housing cost in Turkey in 2025?
Average house prices in major cities of Turkey in Q1 2025 are:
- Istanbul: 1682 USD/sq.m.
- Antalya: 1196 USD/sq.m.
- Izmir: 1153 USD/sq.m.
- Ankara: 919 USD/sq.m.
- Bursa: 836 USD/sq.m.
- Mersin: 814 USD/sq.m.
Will foreigners buy property in Turkey in 2025?
Yes, but the volume of purchases by foreigners is declining. In January-May 2025, foreigners purchased 7,789 housing units, which is 13.7% less than in the same period in 2024. The largest number of purchases are made by citizens of Russia, followed by citizens of Iran, Ukraine, Germany, and Iraq.
In which cities in Turkey do people buy the most housing?
The largest number of transactions for January-May 2025 was registered in:
- Istanbul: 98,827 transactions.
- Ankara: 54,016 transactions.
- Izmir: 36,877 transactions.
- Antalya: 31,954 transactions.
- Bursa: 20,058 transactions.
- Mersin: 20,054 transactions.
Are property prices rising in Turkey?
Yes, prices continue to rise. The house price index in May 2025 was 182.38 points, up 32.3% from May 2024. Price increases were recorded in 76 of Turkey's 81 provinces, with 14 provinces seeing prices rise by more than 40% in a year.
Which areas of Istanbul are the most expensive to buy a home?
The most expensive areas of Istanbul (data for June 2025):
- Besiktas: 3,548 USD/sq.m.
- Sariyer: 3,482 USD/sq.m.
- Kadikoy: 3,429 USD/sq.m.
- Beykoz: 2,679 USD/sq.m.
- Bakirkoy: 2,561 USD/sq.m.
Where is the most affordable housing in Istanbul?
The most affordable areas of Istanbul (data for June 2025):
- Esenyurt: 657 USD/sq.m.
- Sultangazi: 849 USD/sq.m.
- Güngören: 867 USD/sq.m.
- Arnavutkoy: 877 USD/sq.m.
- Avcilar: 932 USD/sq.m.
Has Turkey's housing market recovered after the 2023 earthquake?
Yes, the Turkish housing market has shown the ability to recover quickly. After a decline in 2023, sales volumes increased by 20.6% in 2024, and in 2025, growth continued at a rate of +25.4% in the first 5 months.