Apartment Prices in Estonia 2025: Tallinn, Tartu, Pärnu — Market Overview
The Estonian apartment market has been relatively stable over the past 2–2.5 years. Demand and buyer activity remain at the level of previous periods, and average apartment prices have not shown any significant changes. Average prices in actual purchase and sale transactions in the country’s largest cities in the second quarter of 2025 showed both an increase and a decrease, and in general, it can be said that prices have varied within the same level for several quarters in a row.
Overall Dynamics of Apartment Prices in Estonia in 2025
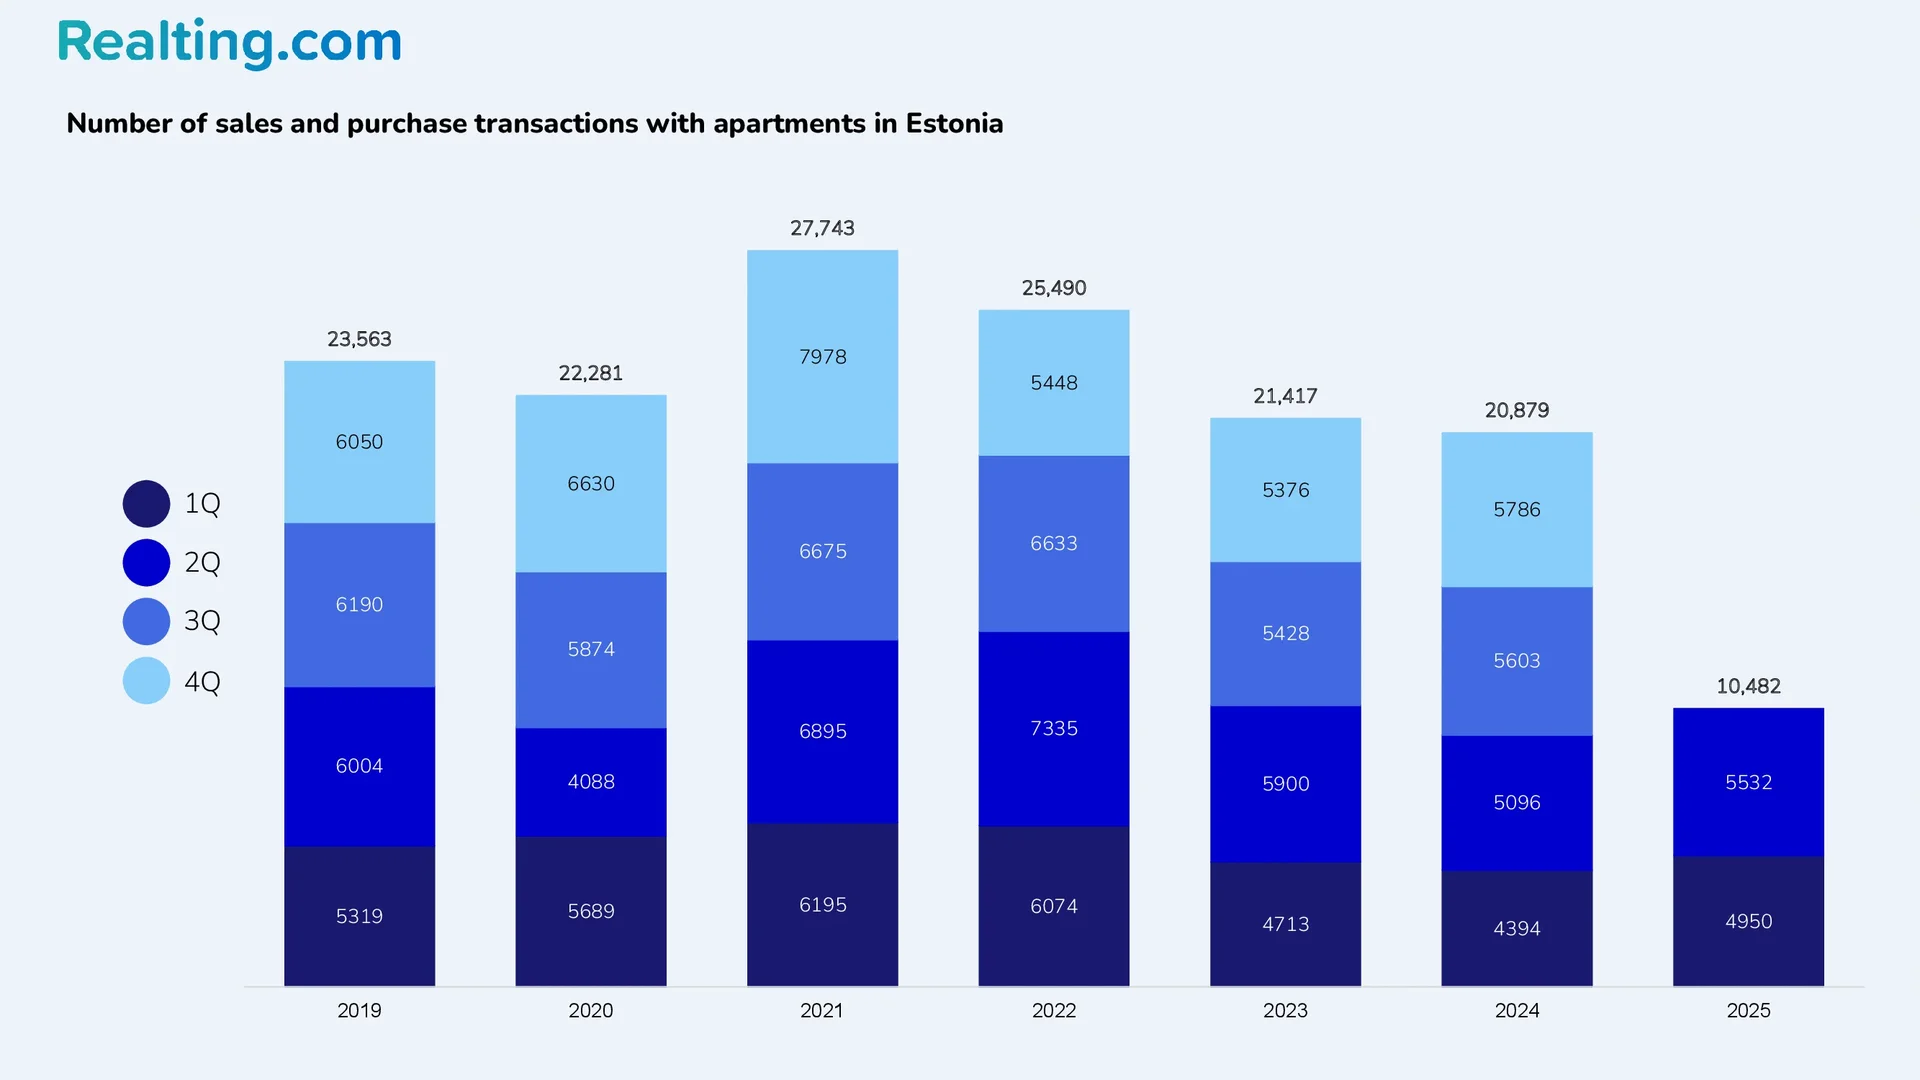
According to the data of the Estonian Land and Spatial Planning Department (Maa- ja Ruumiamet), 5,532 apartment purchase and sale transactions were registered in the country in the second quarter of 2025, which is 11.8% more than in the previous quarter and 8.6% more than in the second quarter of last year.
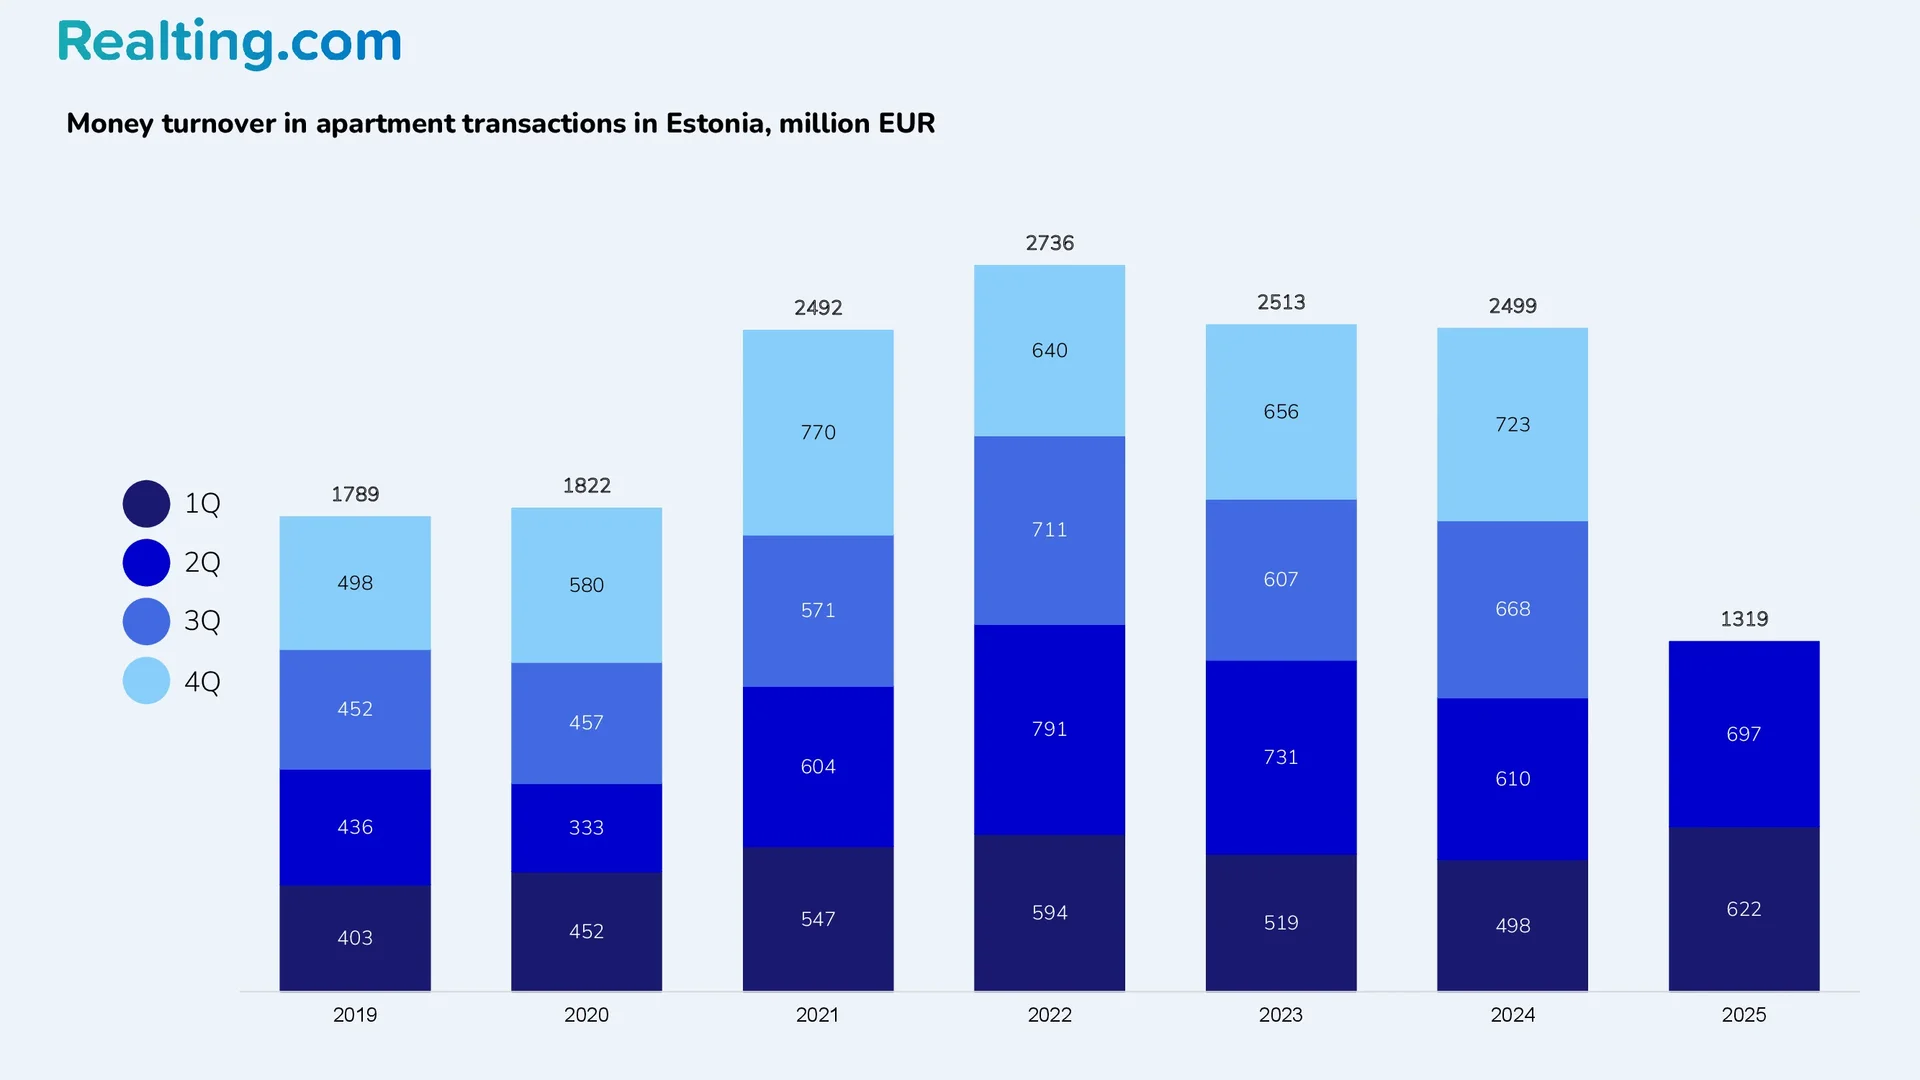
The apartment turnover in Estonia in the 2nd quarter of this year amounted to EUR 697 million. Compared to the 1st quarter, the turnover increased by 12.1%: compared to the 2nd quarter of last year, the growth was 14.3%.
Apartment Market by County in Estonia
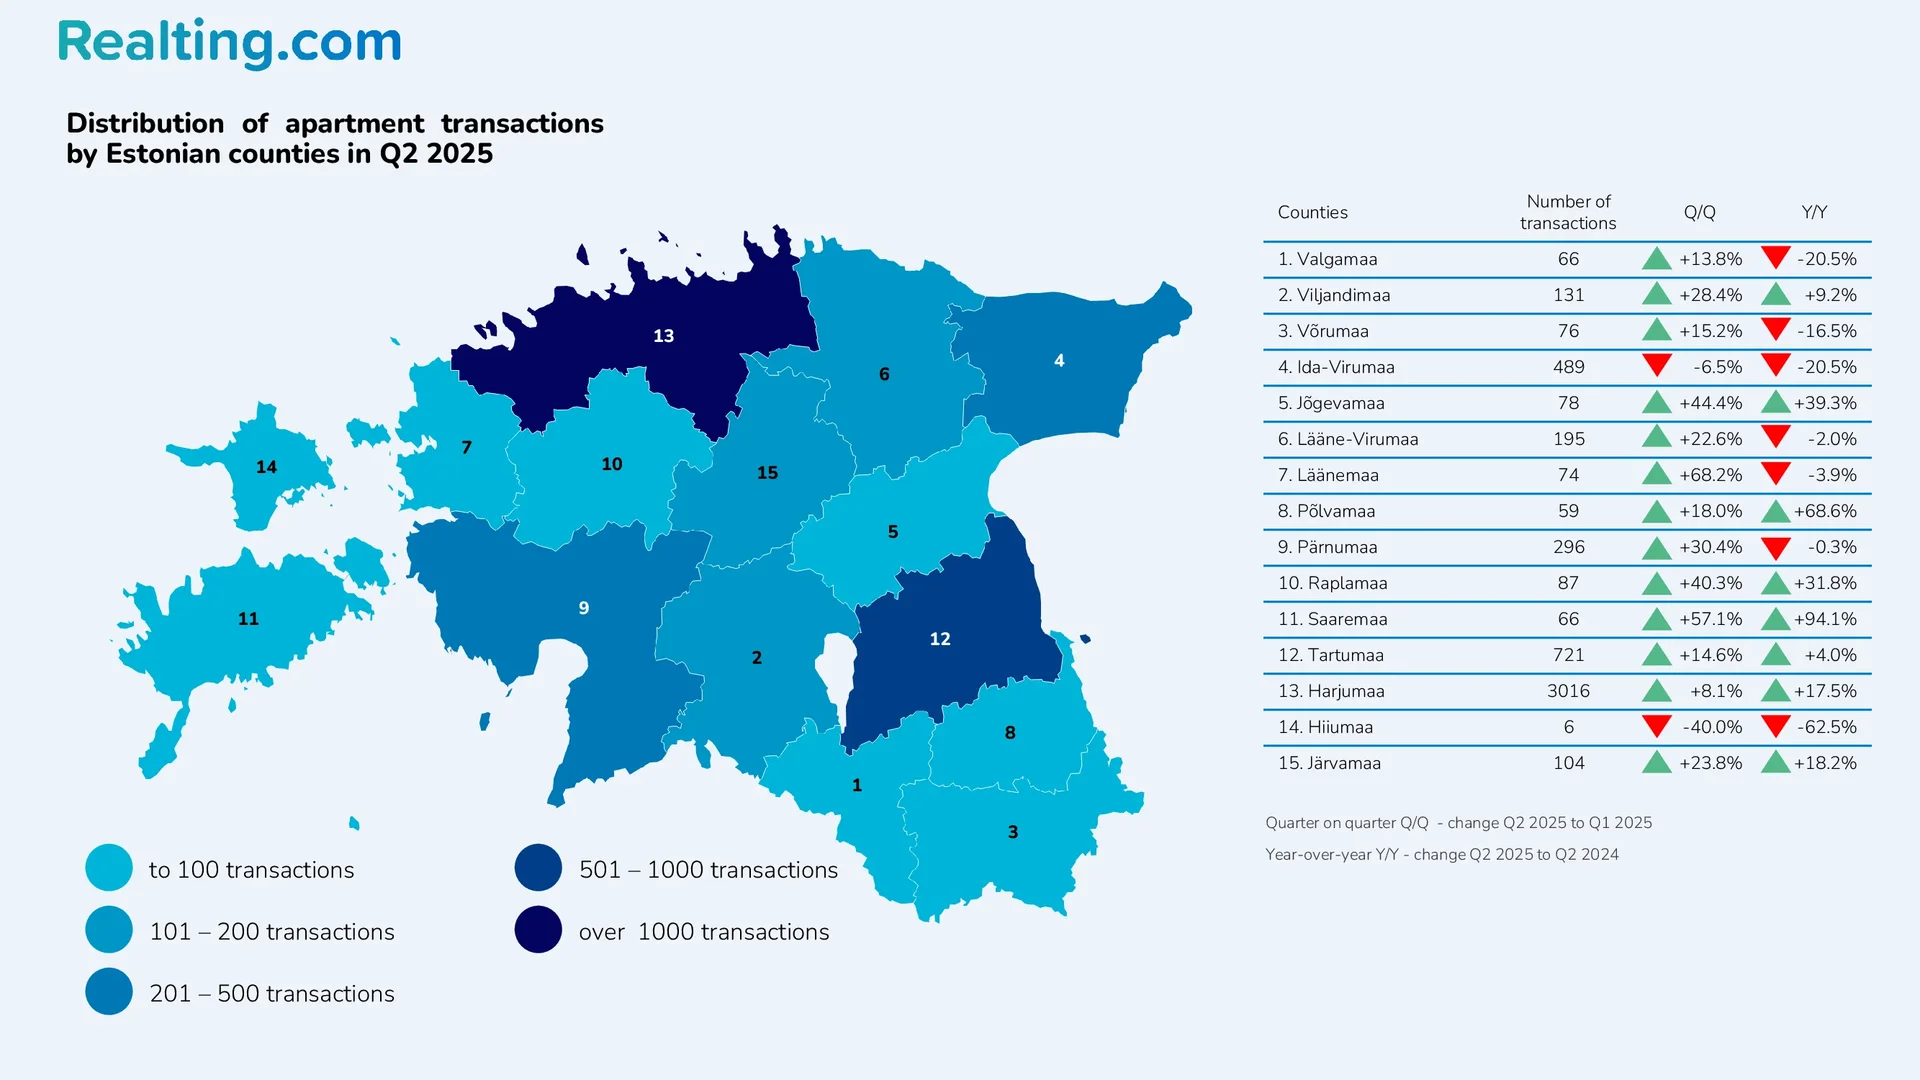
Among the counties (an administrative-territorial unit, there are 15 counties in the country), the permanent leader in both in apartment transactions Estonia and the volume of money turnover is Harju County, where more than 50% of apartment transactions are traditionally made. In the 2nd quarter of 2025, 3,016 apartment purchase and sale transactions were registered in this county (51% of all apartment transactions in the country), which is 8.1% more than in the 1st quarter of this year and 17.5% more than in the 2nd quarter of 2024.
Next in terms of the number of apartment transactions are Tartu County and Ida-Viruuma County — 721 and 489 apartment transactions, respectively. In turn, the fewest apartment transactions were registered in Hiiumaa County — this is the smallest county in Estonia, which is located on the island of the same name as the county and includes several other small islands. Only 6 apartment transactions were registered in this county, and traditionally, Hiiumaa is at the bottom of the list of Estonian counties by the number of apartment transactions. This is not surprising, since the housing stock of this county is primarily represented by houses, not apartment buildings.
Popular Apartment Sizes and Transaction Structure
In the 2nd quarter of 2025, 12% of all apartment purchase and sale transactions in Estonia were made on the primary market, which is slightly lower than in the previous period. It is worth noting that until 2023, the share of new apartments in transactions averaged around 20% per quarter, but since the 1st quarter of 2024, it has decreased to 13% and since then has varied between 12–15%.
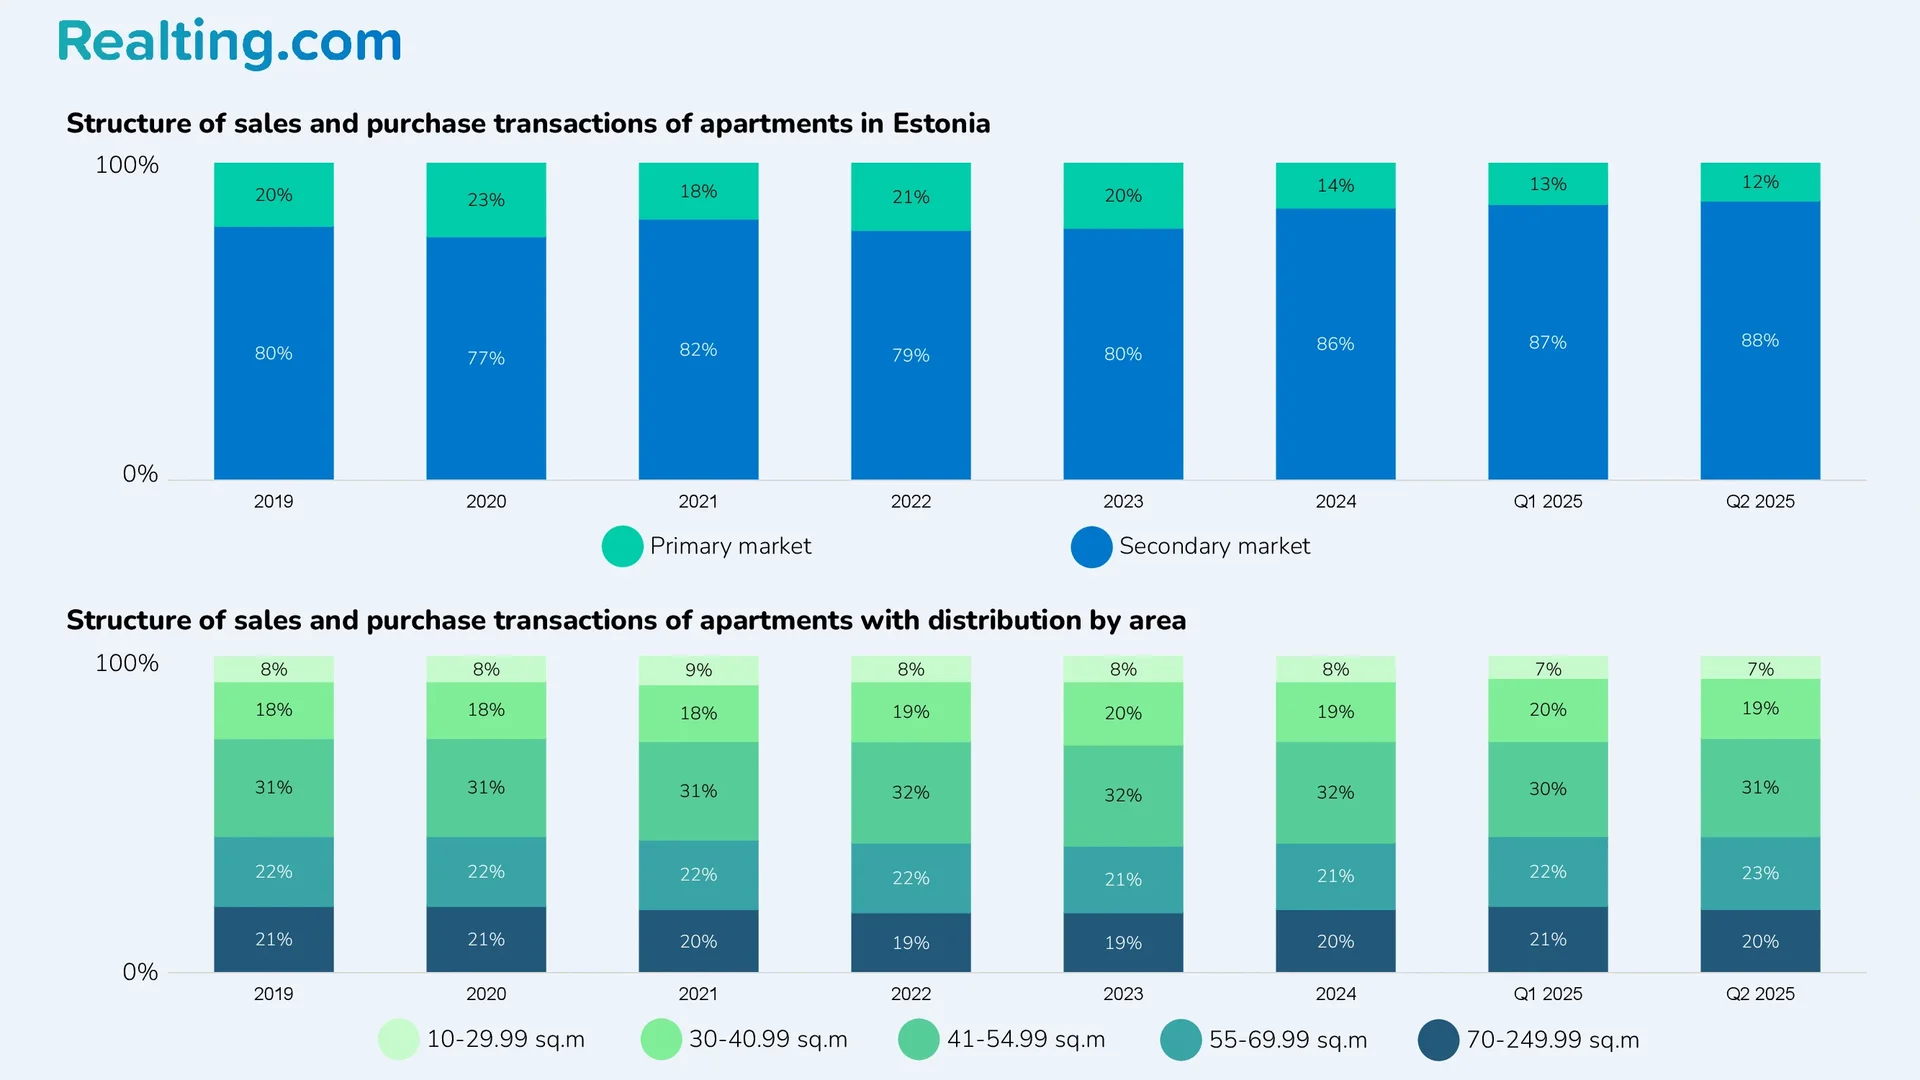
Apartments with an area of 30 to 40.99 sq. m are the most popular on the Estonian apartment market. Apartments of this size account for almost a third of all apartment transactions in the country every quarter. In turn, small apartments (10–29.99 sq. m) are the least popular — the share of such apartments in purchase and sale transactions is 7–9% per quarter.
In the 2nd quarter of 2025, 53.4% of all apartment purchase and sale transactions in the country were in the 3 largest cities — Tallinn, Tartu, Pärnu. According to statistics from the Land and Spatial Planning Department of Estonia (Maa- ja Ruumiamet), the total number of apartment transactions in these three cities was 2953.
In Tallinn, 2291 apartment transactions were registered in the 2nd quarter of this year, which is 7.4% more than in the 1st quarter. The number of transactions has increased by 18.5% over the year. The share of new apartments in transactions in the 2nd quarter of 2025 was 13%.
In Tartu, the number of apartment transactions in the 2nd quarter of 2025 was 466, which is 14.8% more than in the previous quarter and comparable to the 2nd quarter of last year. The share of the primary market in the 2nd quarter of 2025 was 11% of all apartment transactions in the city.
In turn, in Pärnu, 196 apartment transactions were registered in the 2nd quarter of this year, which is similar to the previous quarter and 7.1% more than in the 2nd quarter of 2024. The share of new apartments in the 2nd quarter of 2025 was 13.8%.
Housing Price Index in Estonia: Dynamics for 2024–2025
The housing price index in 2025 started with an increase. According to Statistics Estonia, in the first quarter of 2025, the housing price index increased by 3% quarterly and 4.6% year-on-year-
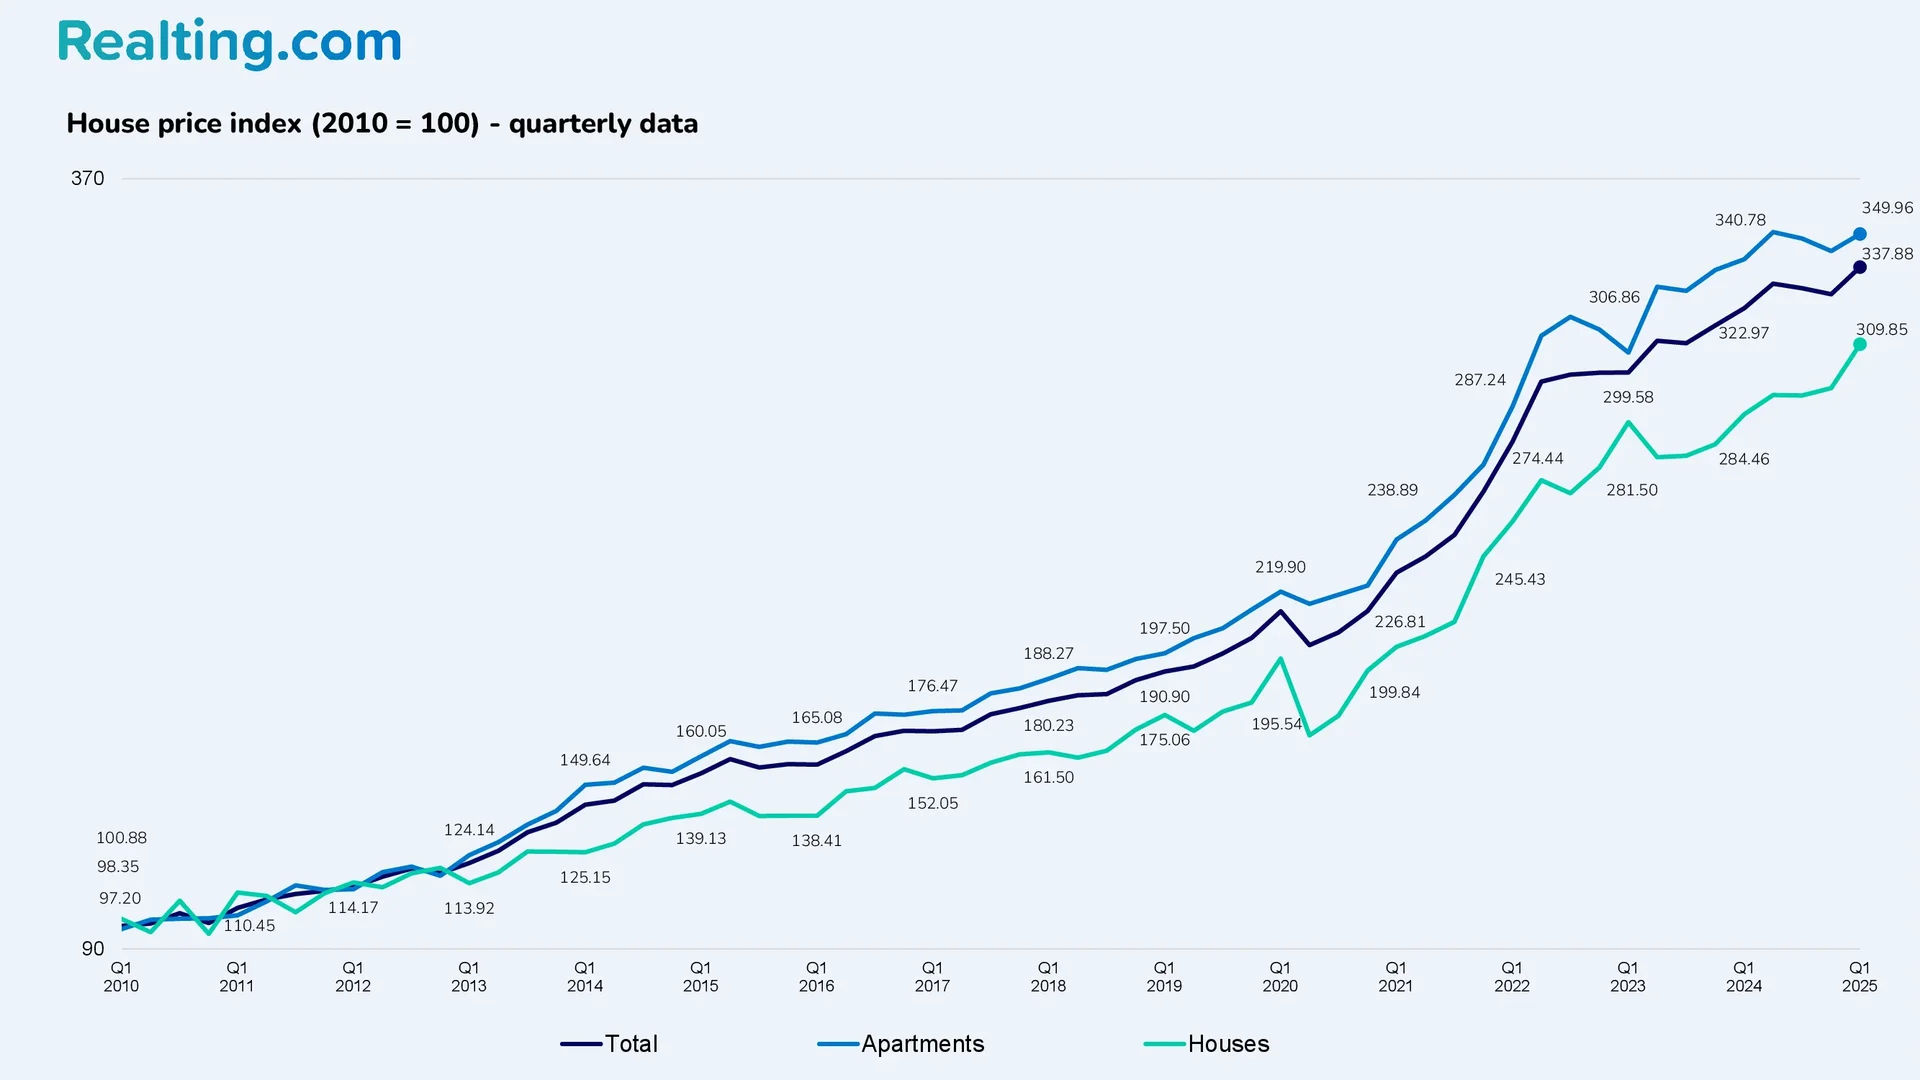
The apartment price index for Q1 2025 increased by 1.8% compared to Q4 2024 and by 2.7% compared to Q2 2024.
In turn, the house price index showed a more significant increase. Thus, compared to Q4 2024, the house price index increased by 5.4%, and the annual increase was 8.9%.
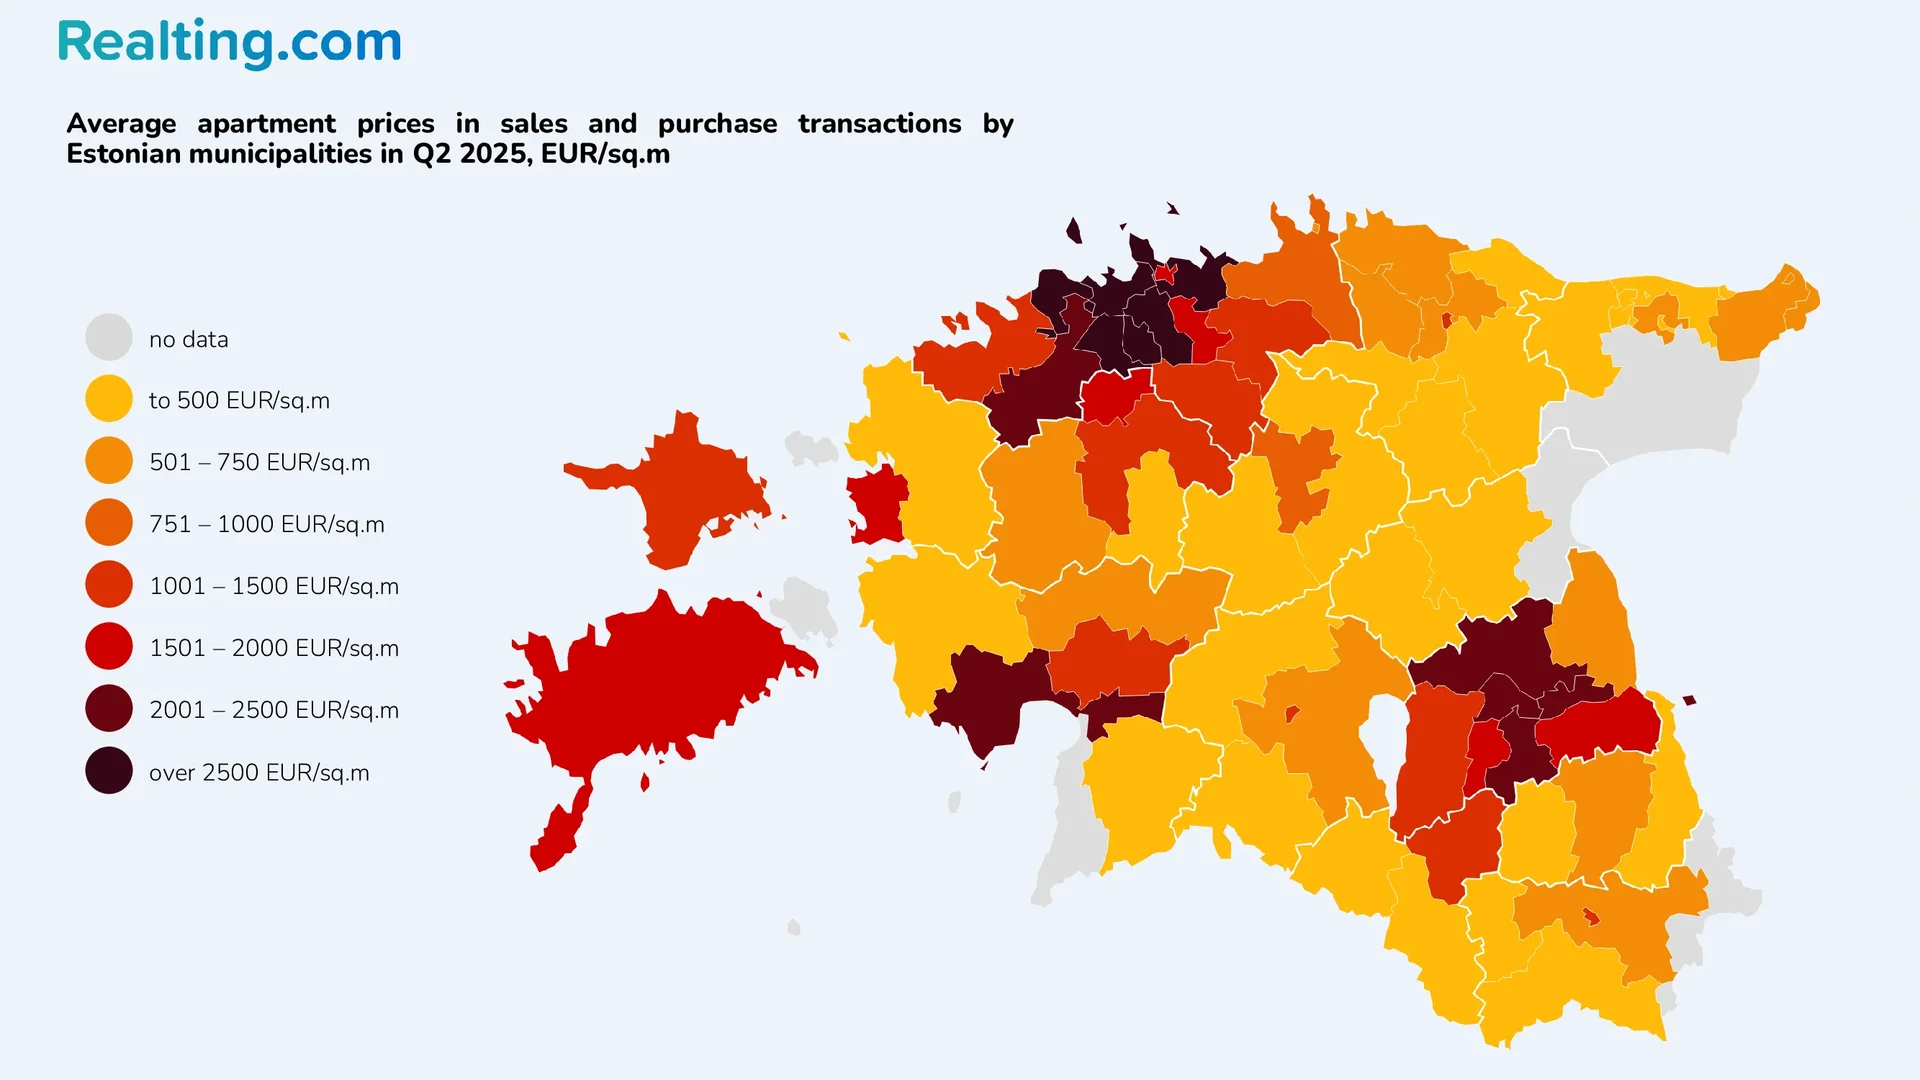
The average price of one square meter of an apartment in Estonia varies significantly from municipality to municipality. In Q2 2025, in 37 out of 79 municipalities, the average price per square meter in apartment purchase and sale transactions did not exceed 750 EUR/sq. m. To give a more accurate picture of the distribution of apartment prices in Estonian municipalities, we will quote from the 2024 real estate market news report of the Estonian Land and Spatial Planning Department (Maa- ja Ruumiamet):
“The price level in different areas still varies greatly: while in smaller settlements such as Sonda, Misso, Püssi and Kiviõli, an average Estonian salary can buy an apartment of 20 square meters, in the Kalaranna area of Tallinn the price per square meter can exceed EUR 10,000. This means that it takes an average of 3 months of work to buy one square meter in the most expensive area of Tallinn.”
By the way, according to Statistics Estonia, the average monthly gross wage in the first quarter of 2025 was EUR 2,011.
Comparison of Asking Prices and Actual Transaction Prices in Major Cities
Let’s take a closer look at the average prices of apartments in the largest cities of Estonia at the end of the 2nd quarter of 2025 in purchase and sale transactions and sales offers. According to price statistics from the largest real estate portal in Estonia KV. EE, the average price per square meter in sales offers for apartments in Tallinn in June 2025 was 3700 EUR/sq. m, which is 5.4% more than in June last year. In Tartu and Pärnu, the average price in sales offers was 2840 and 2917 EUR/sq. m, which is 6.8% and 4.2% more than in June 2024, respectively.
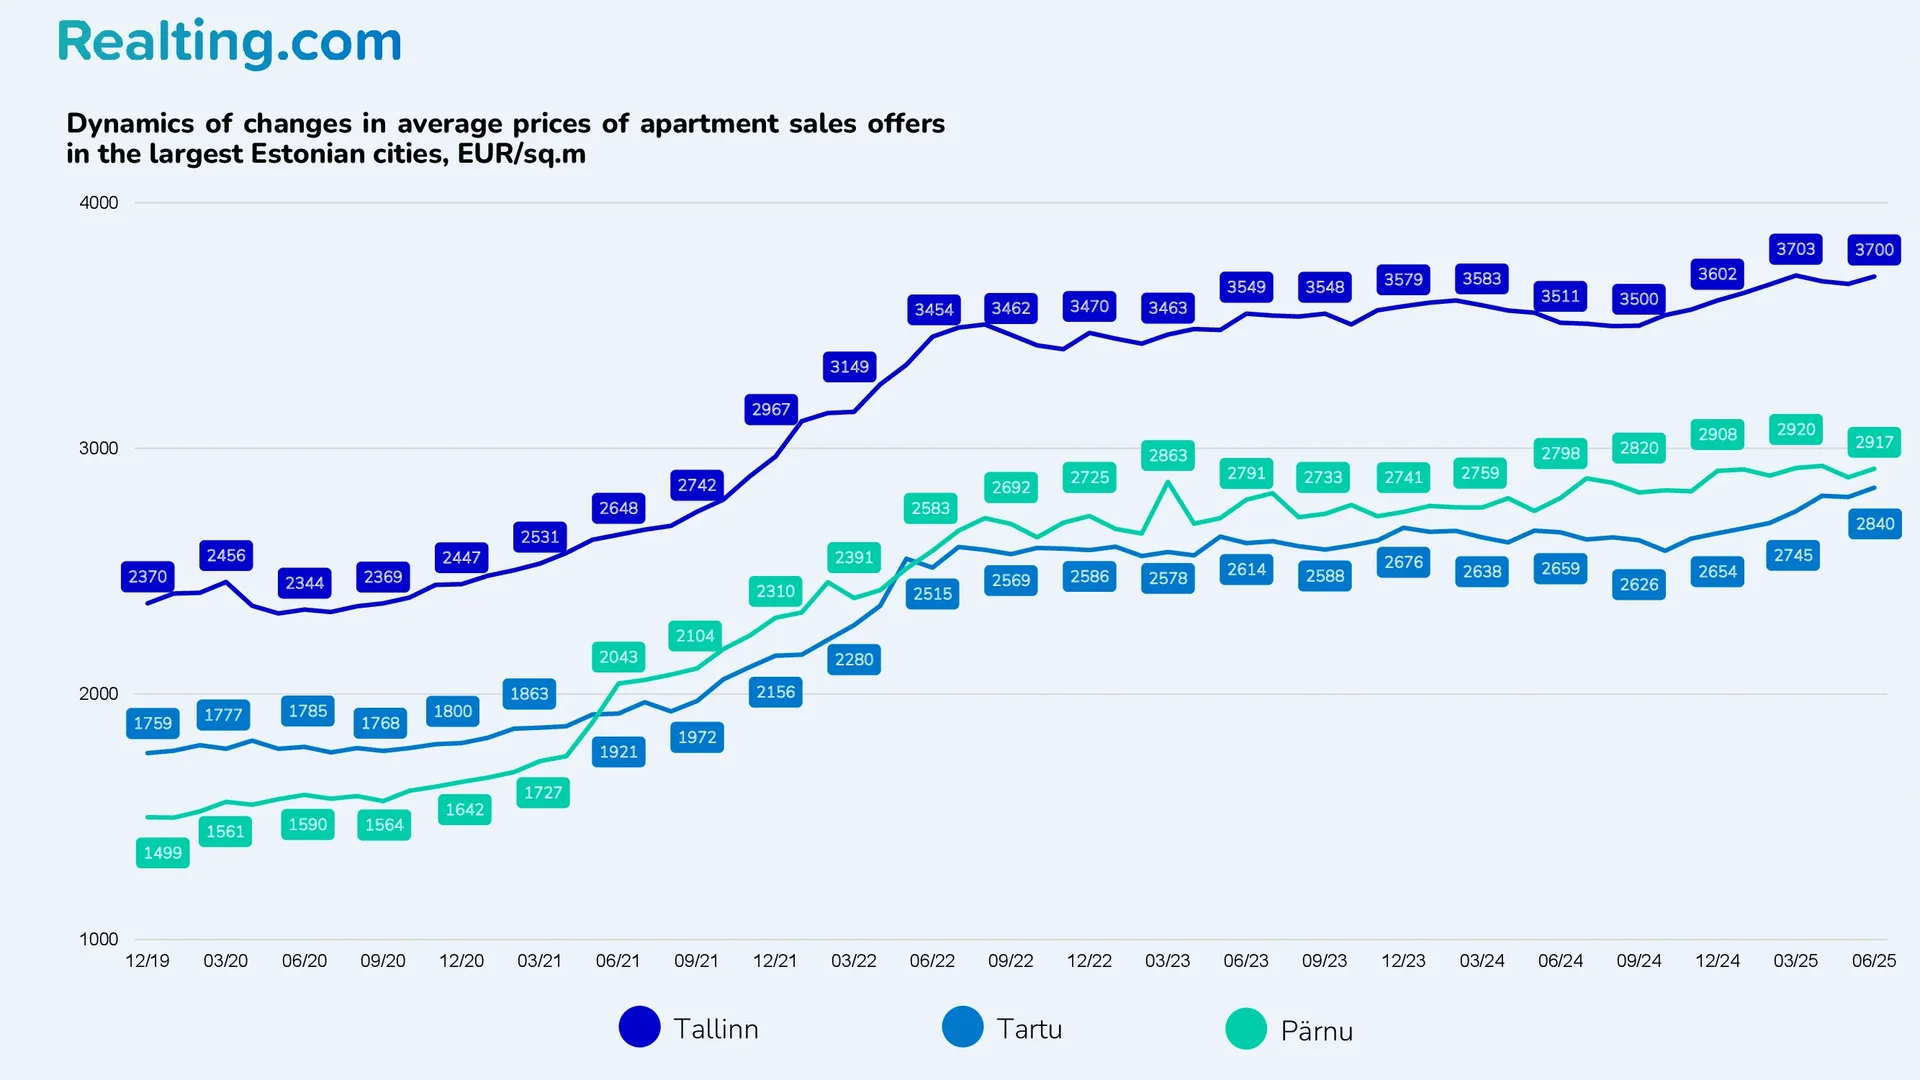
In turn, the average prices in actual purchase and sale transactions in Tallinn, Tartu and Pärnu are 14-20% lower than the average prices in sales offers.
In the 2nd quarter of 2025, the Land and Spatial Planning Department of Estonia (Maa- ja Ruumiamet) provides the following average prices of apartments in these cities:
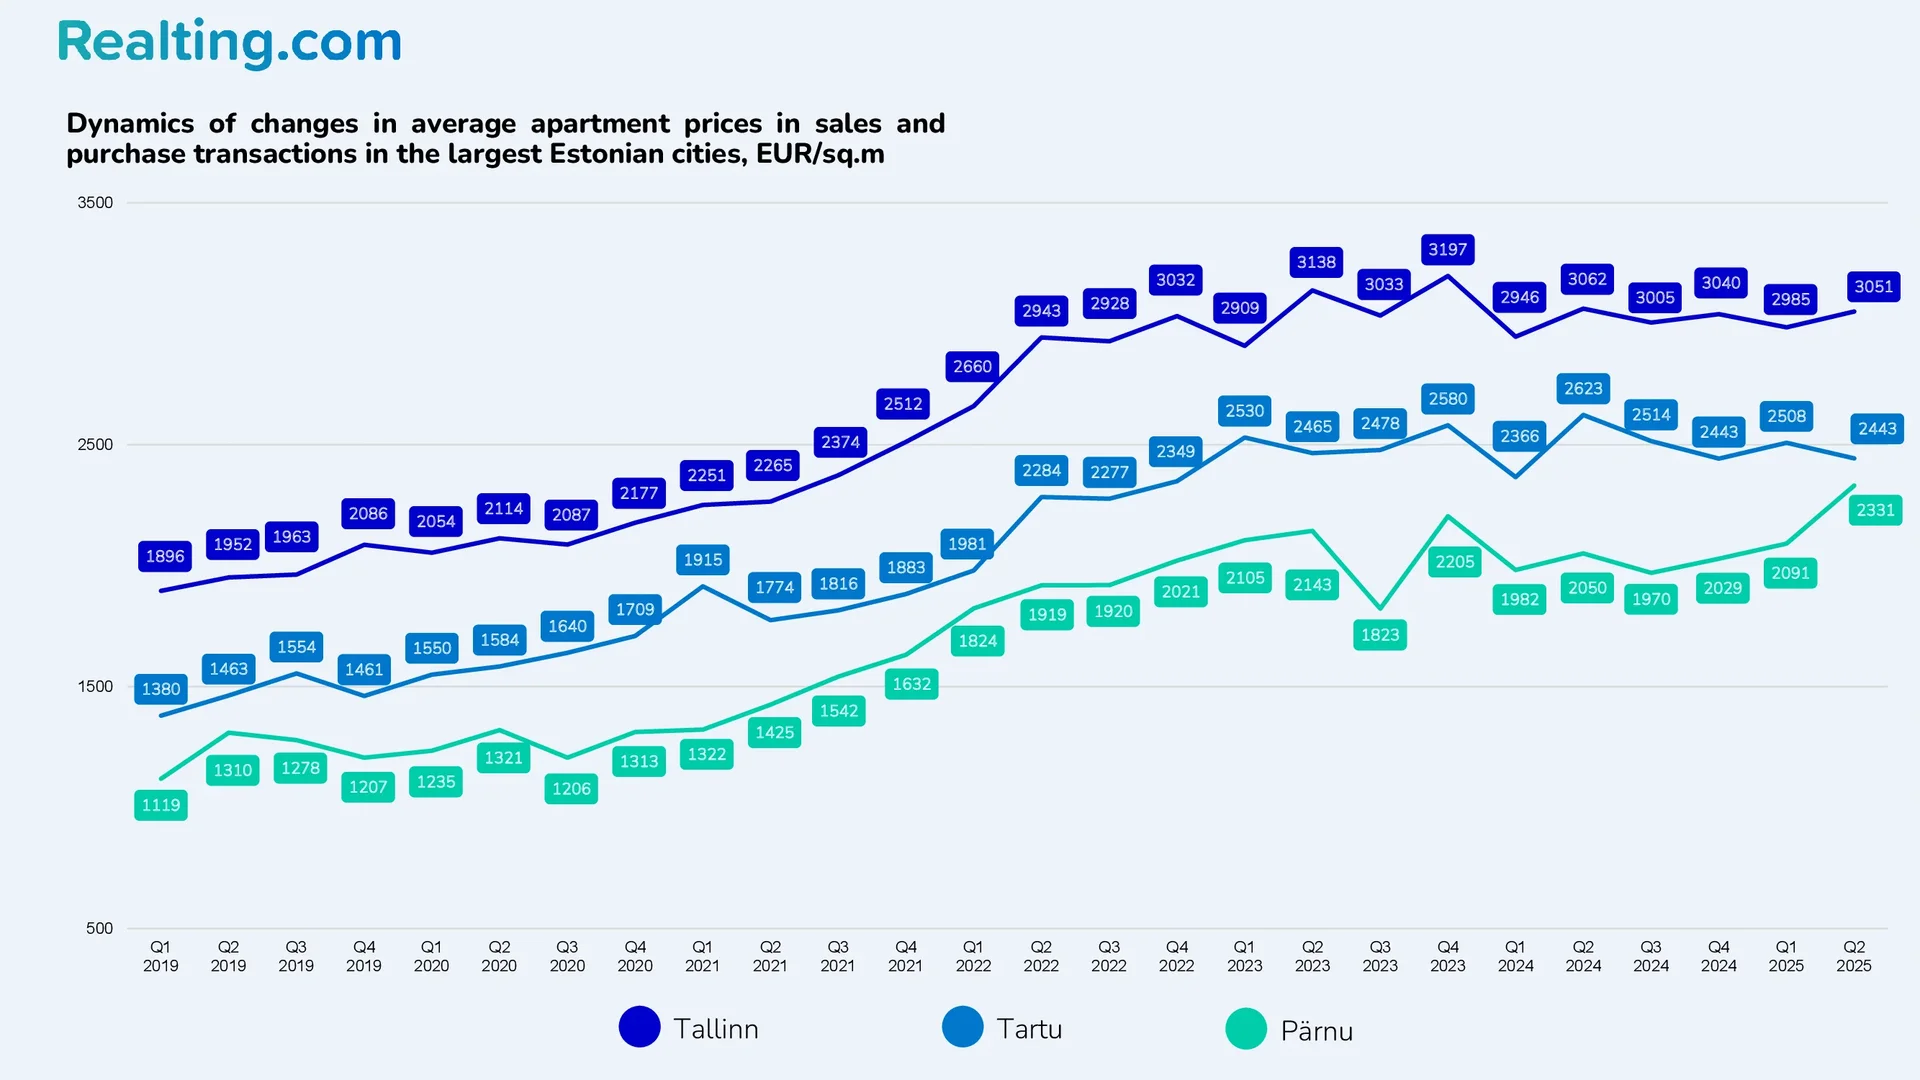
- In Tallinn, the average price per square meter in Tallinn Q2 2025 was 3051 EUR/sq. m., which is 2.2% more than in Q1 2025 and 0.4% less than in Q2 2024. This positions Tallinn as the most expensive city in the Estonian apartment market, with demand concentrated in prime districts.
- Tartu apartment prices averaged 2443 EUR/sq. m. Compared to Q1 this year, the average price has decreased by 2.6%, and compared to Q2 last year, the decrease was 6.8%.
- Pärnu apartment prices stood at 2331 EUR/sq. m. In Q2 2025, the average price per square meter has increased by 11.5% compared to Q1 2025 and by 13.7% compared to Q2 2024.
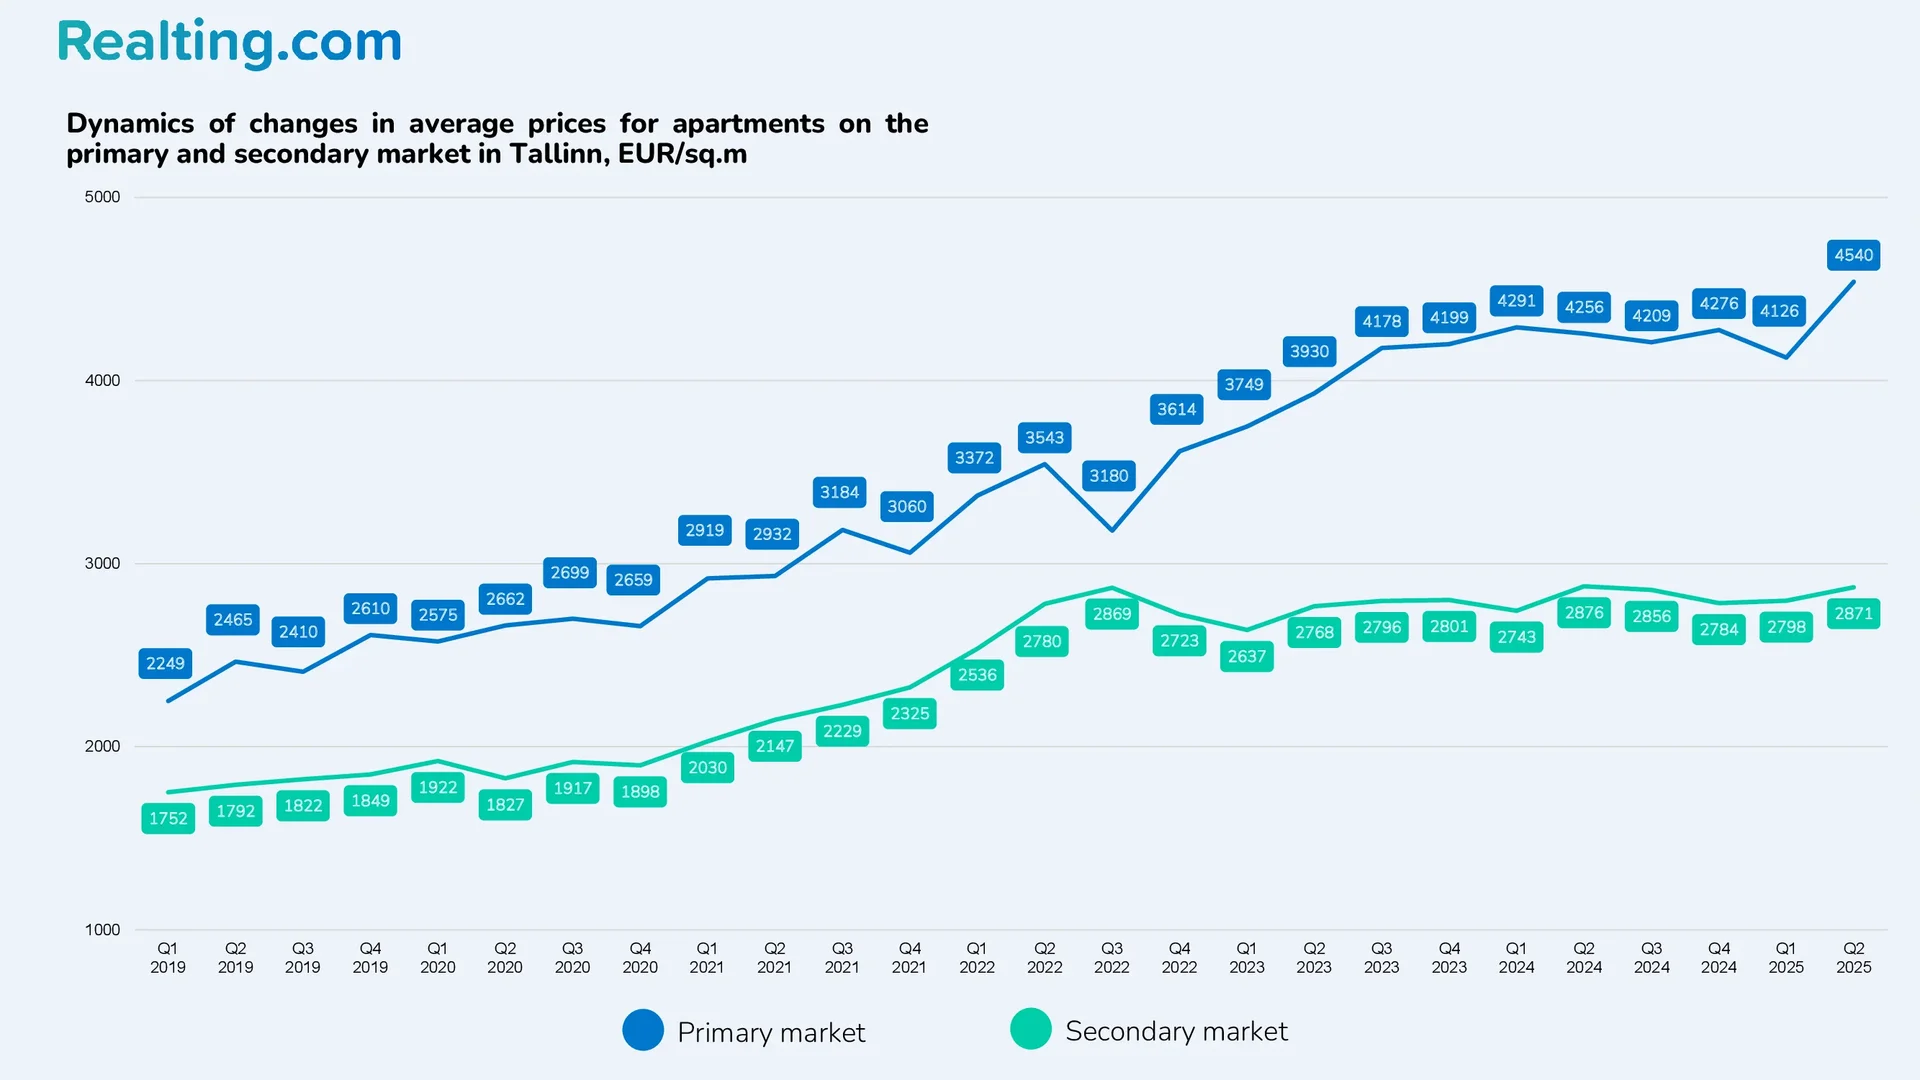
In the capital of Estonia, in the 2nd quarter of 2025, the average price per square meter of an apartment on the primary market was 4,540 EUR/sq. m. — over the year, average prices on the primary market have increased by 6.7%. In turn, on the secondary market, the average price per square meter in purchase and sale transactions was 2,871 EUR/sq. m., which is generally comparable to the level of the same period last year.
In Summary
The Estonian apartment market in the second quarter of 2025 is showing signs of stabilization with moderate growth in activity — the number of deals went up 11.8%, and cash turnover rose 12.1%. Price dynamics remain mixed: growth in Tallinn (+2.2%) and Pärnu (+11.5%) against a backdrop of decline in Tartu (-2.6%), reflecting the local characteristics of each market.
The current situation remains favorable for buyers thanks to the significant gap between asking prices and actual transactions (14-20%), the dominance of the secondary market (88% of transactions), and the absence of sharp price fluctuations. The steady demand for compact apartments of 30–41 square meters confirms the rational approach of buyers in the context of the current level of household income.