
UK Housing Market Analysis: Explosive Sales Growth in Q1 2025 Amid Tax Changes, and What’s Next
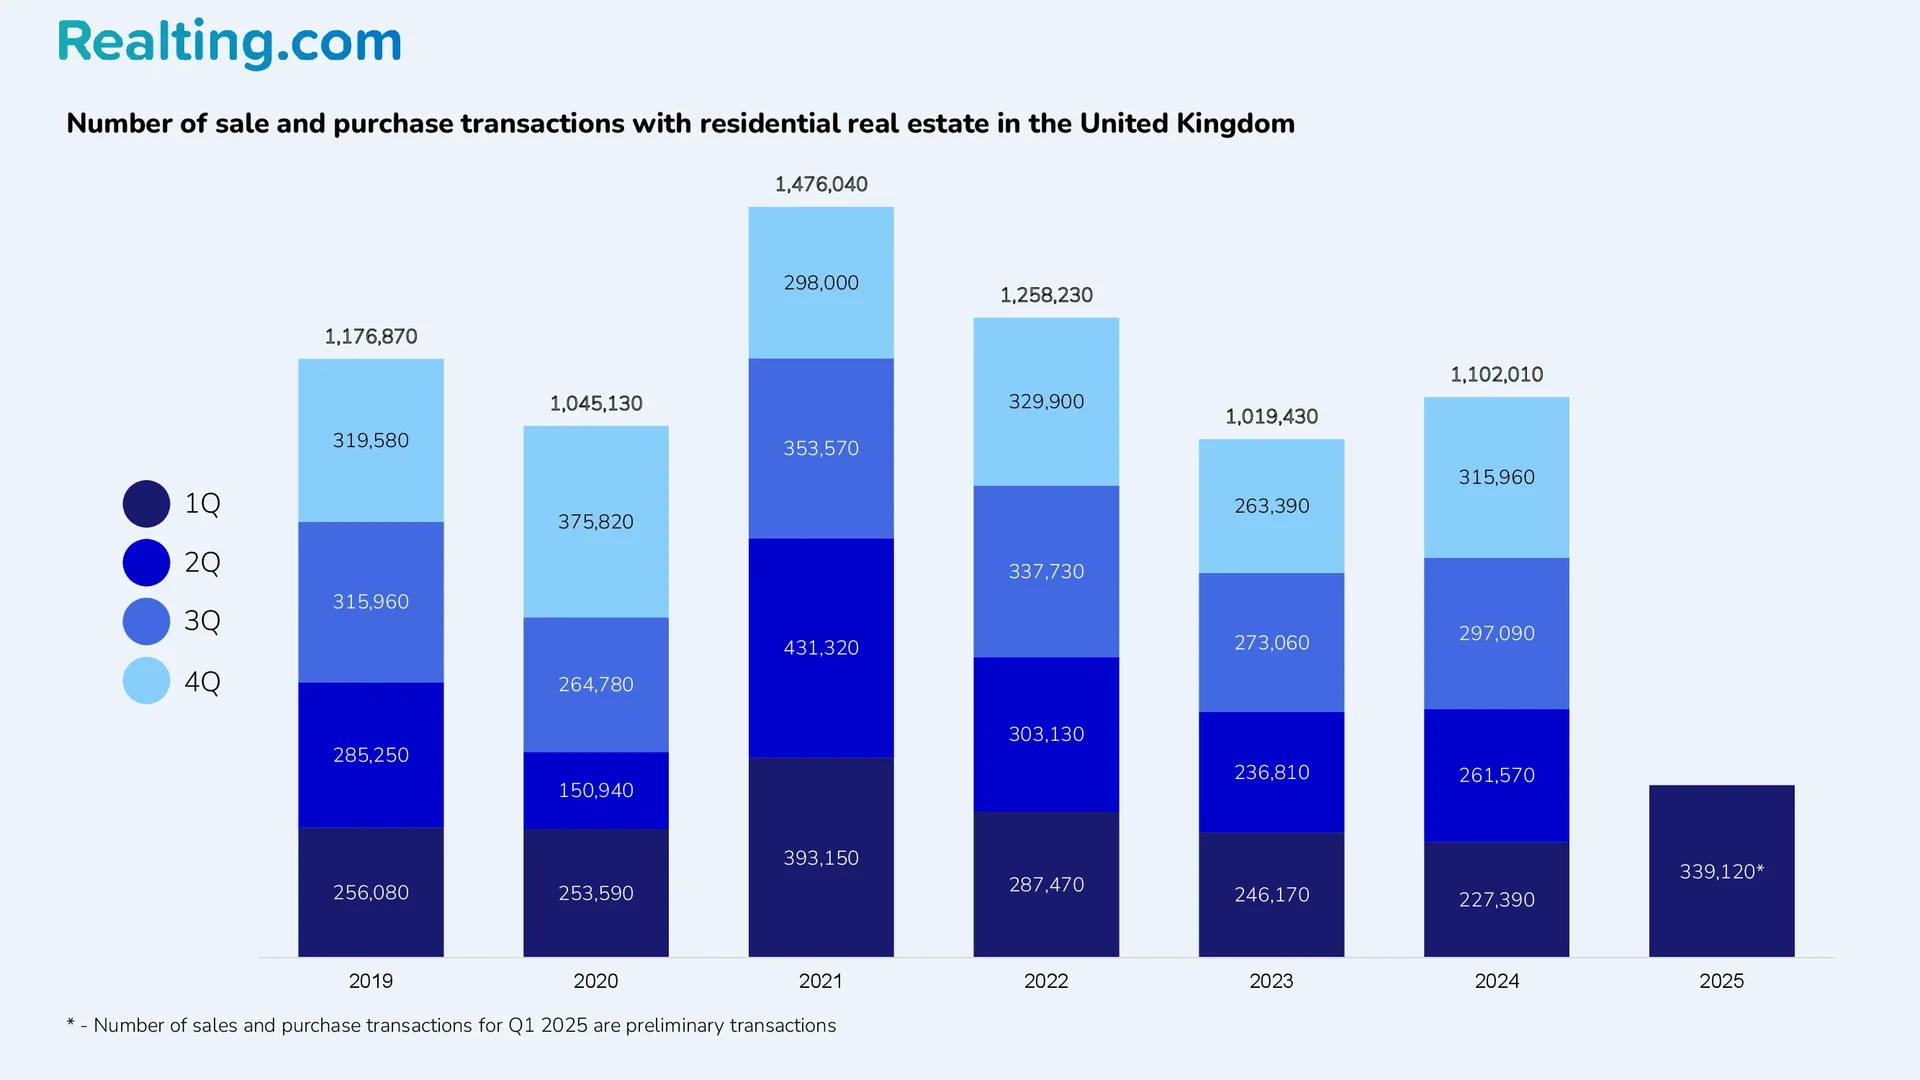
There were 1,102,010 residential property sales in the UK in 2024, up 8.1% on 2023, according to figures from HM Revenue and Customs (HMRC). However, this is far from remarkable given that 2024 was the third-lowest year for total transactions in a single year over the last decade, only surpassed by 2023 and 2020s.
However, it is also worth noting that since Q2 2024, the UK housing market has seen a quarterly increase in the number of housing transactions. Thus, if in Q1 there were 227,390 transactions registered, then in Q4 there were already 315,960 purchase and sale transactions.
Overall dynamics of the UK property market
The growth in house sales continued in Q1 2025. As of May this year, HMRC reported 339,120 residential property sales in Q1. This was 7.3% more than in Q4 2024 and 49.1% more than in Q1 2024.
The sharp increase in buyer activity in the housing market in Q1 2025, and to some extent in Q4 2024, is associated with the desire of the British to complete property purchase transactions before the new stamp duty rules come into effect. Stamp duty is a tax that must be paid when buying real estate or land in England and Northern Ireland.
The amount of stamp duty depends on the value of the property, the purpose of use, and whether the buyer has other real estate. The fact that the UK will face changes in stamp duty in England and Northern Ireland was announced in October 2024, and the changes themselves came into force in April 2025.
Mortgage Strategy described in its article how stamp duty has changed and what amounts will have to be paid when buying real estate. So, from 1 April this year, the tax-free threshold for all buyers dropped from £250,000 to £125,000, and as a result, the tax on the average home in England rose from £2,082 to £4,582.
For first-time buyers, the tax is now levied on properties worth £300,000 (previously, this threshold was £425,000). The average price of a home for first-time buyers in London is around £477,695. The amount of stamp duty for the average first-time buyer in the capital has increased from £2,634 to £8,884.
Based on the data presented in the Mortgage Strategy article, it is clear that the amount of stamp duty has increased several times compared to what it was before. Combined with high mortgage rates and overall high house prices in the UK, it is likely that just as the growth in house sales in Q1 2025 was strong compared to previous periods, there may be a significant decline in sales and buying activity in Q2 2025.
The stamp duty change has meant that most buyers planning to buy a house in the UK in 2025 have tried to complete the transaction in Q1 — the rest are likely to take a wait-and-see approach to the market. The second and third quarters of 2025 may be periods of calm and low activity, but the gradual decline in mortgage rates should add optimism to potential buyers.
Structure of the UK housing market
England is the country/region in the UK that accounts for the majority of residential property transactions in the country. There were 298,850 residential transactions in England in Q1 2025, up 11.7% on Q4 last year and up 55.3% on Q1 the same year. Overall, England accounted for 88% of all residential transactions in the country in Q1 this year.
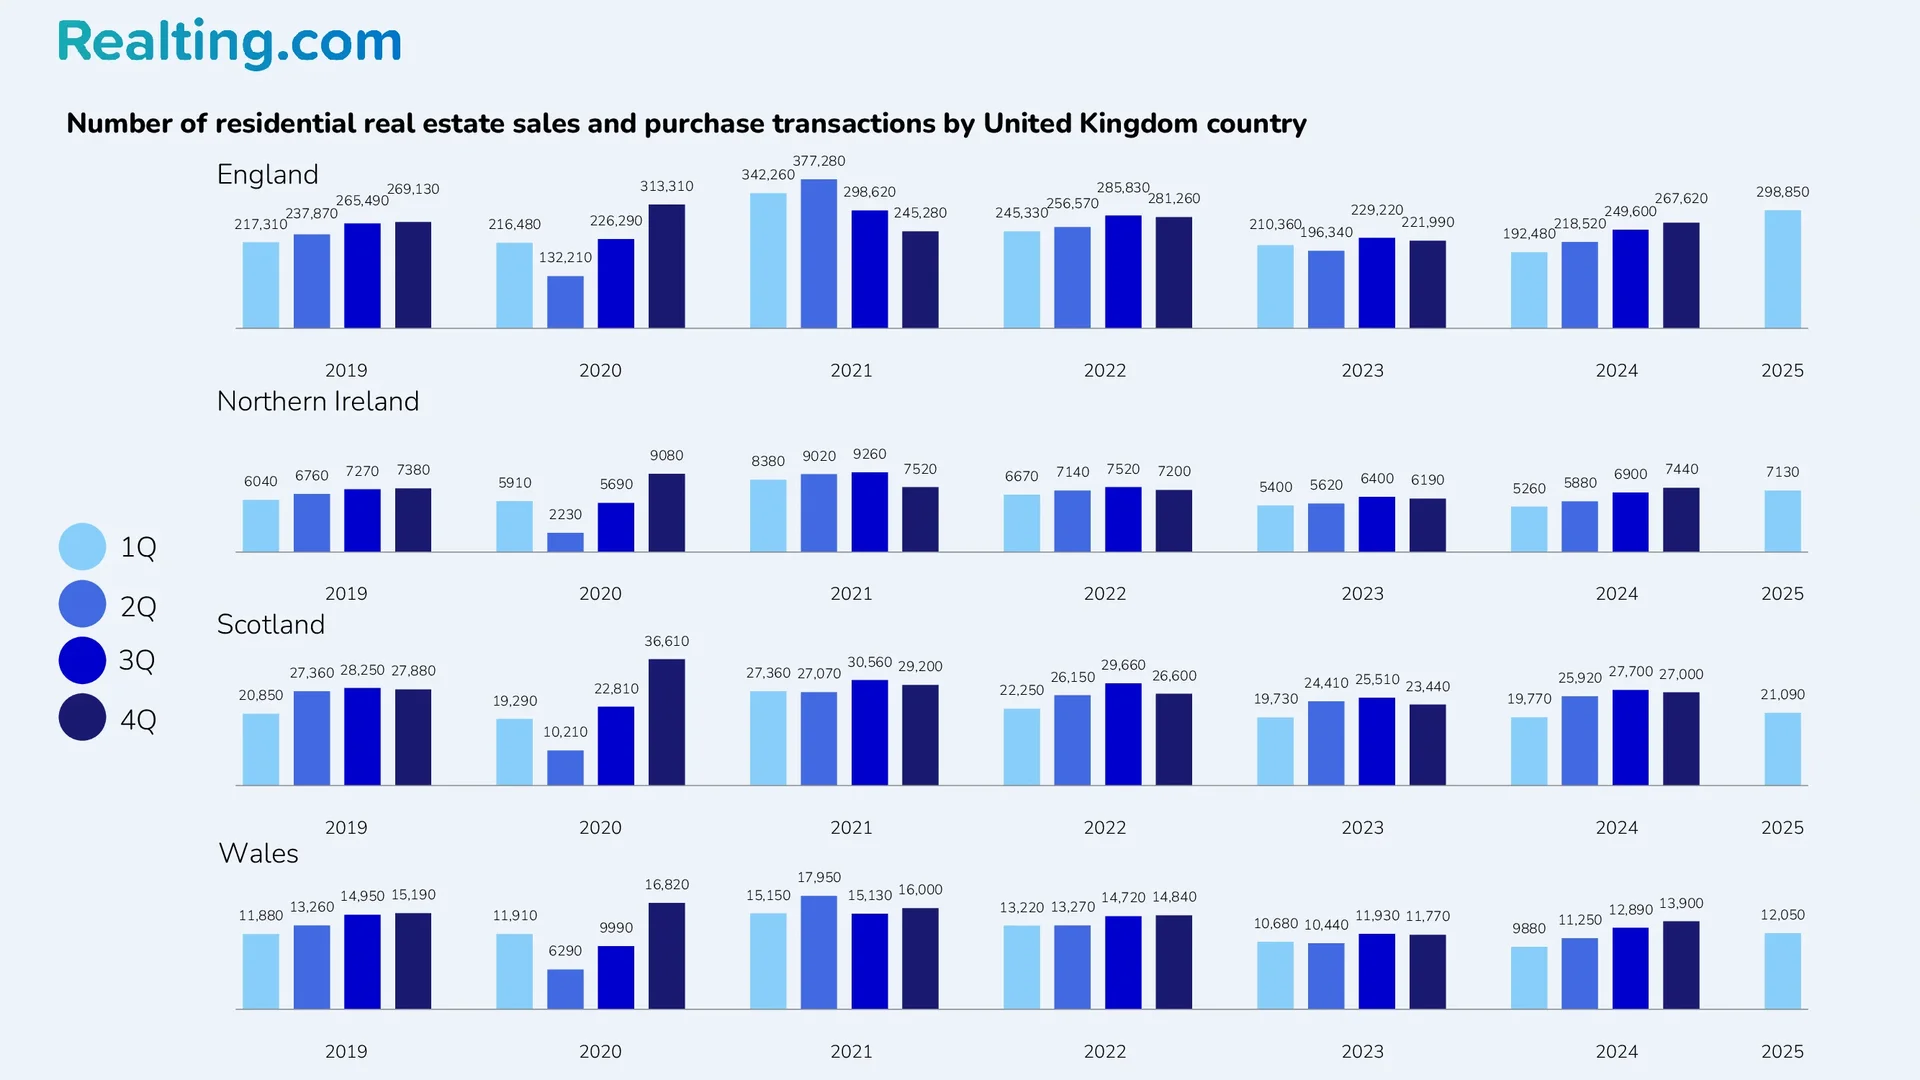
Scotland is the second country in the UK for the number of residential transactions, with 21,090 sales transactions in Q1 2025 (6% of all UK transactions). The change compared to Q4 2024 was −21.9%; compared to Q1 2024, it was +6.7%.
Next comes Wales with 12,050 residential transactions (4% of all UK transactions), down 13.3% on the previous quarter and up 22.0% on the same quarter last year.
The fewest transactions are made in Northern Ireland. In Q1 2025, there were just 7,130 transactions registered there (2% of all UK transactions), down 4.2% on Q4 2024 and up 35.6% on Q1 2024.
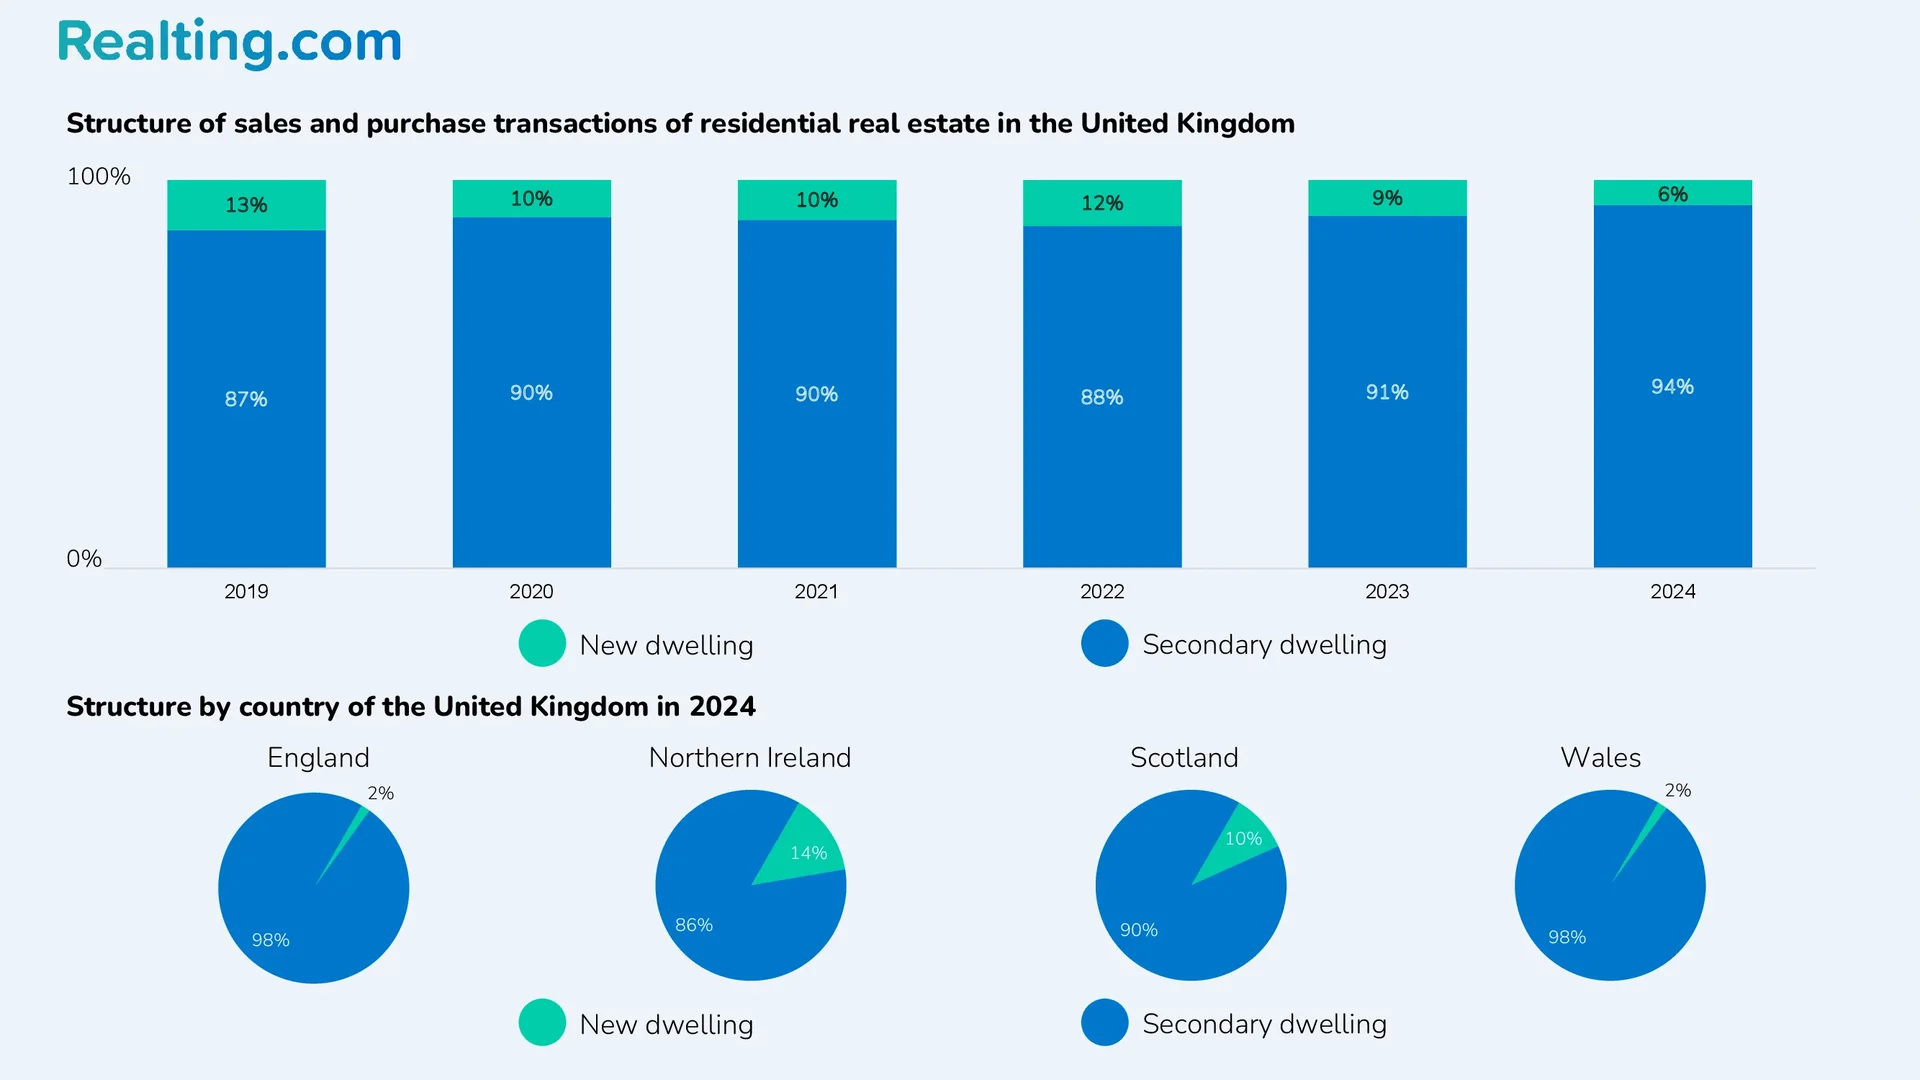
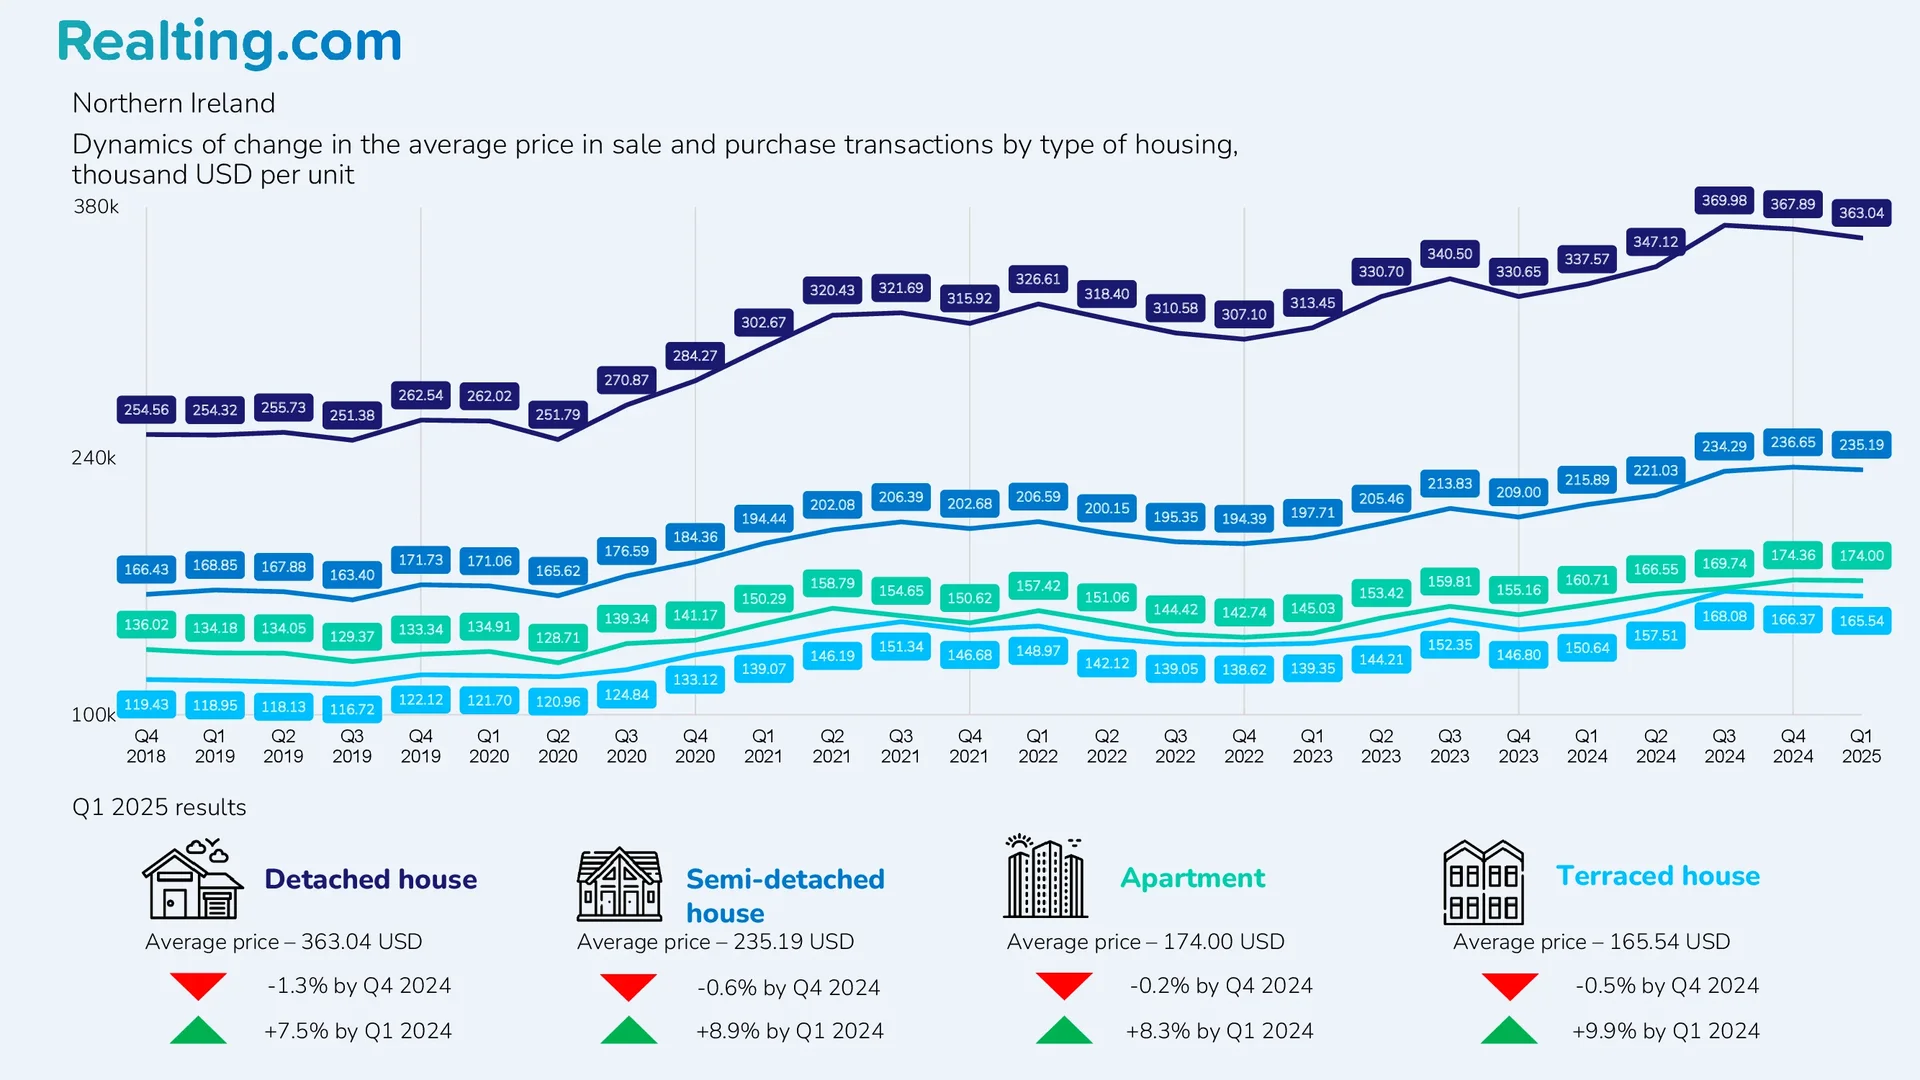
At the end of 2024, only 6% of purchase and sale transactions in the UK residential property market were completed with new housing. The share of new housing in purchase and sale transactions has been declining for the second year in a row. Interestingly, in relative terms, the largest share of new housing in purchase and sale transactions is observed in the country with the fewest transactions — Northern Ireland. In 2024, 14% of all transactions in Northern Ireland were completed with new residential properties, and in 2020, the share of transactions with new housing was 19%.
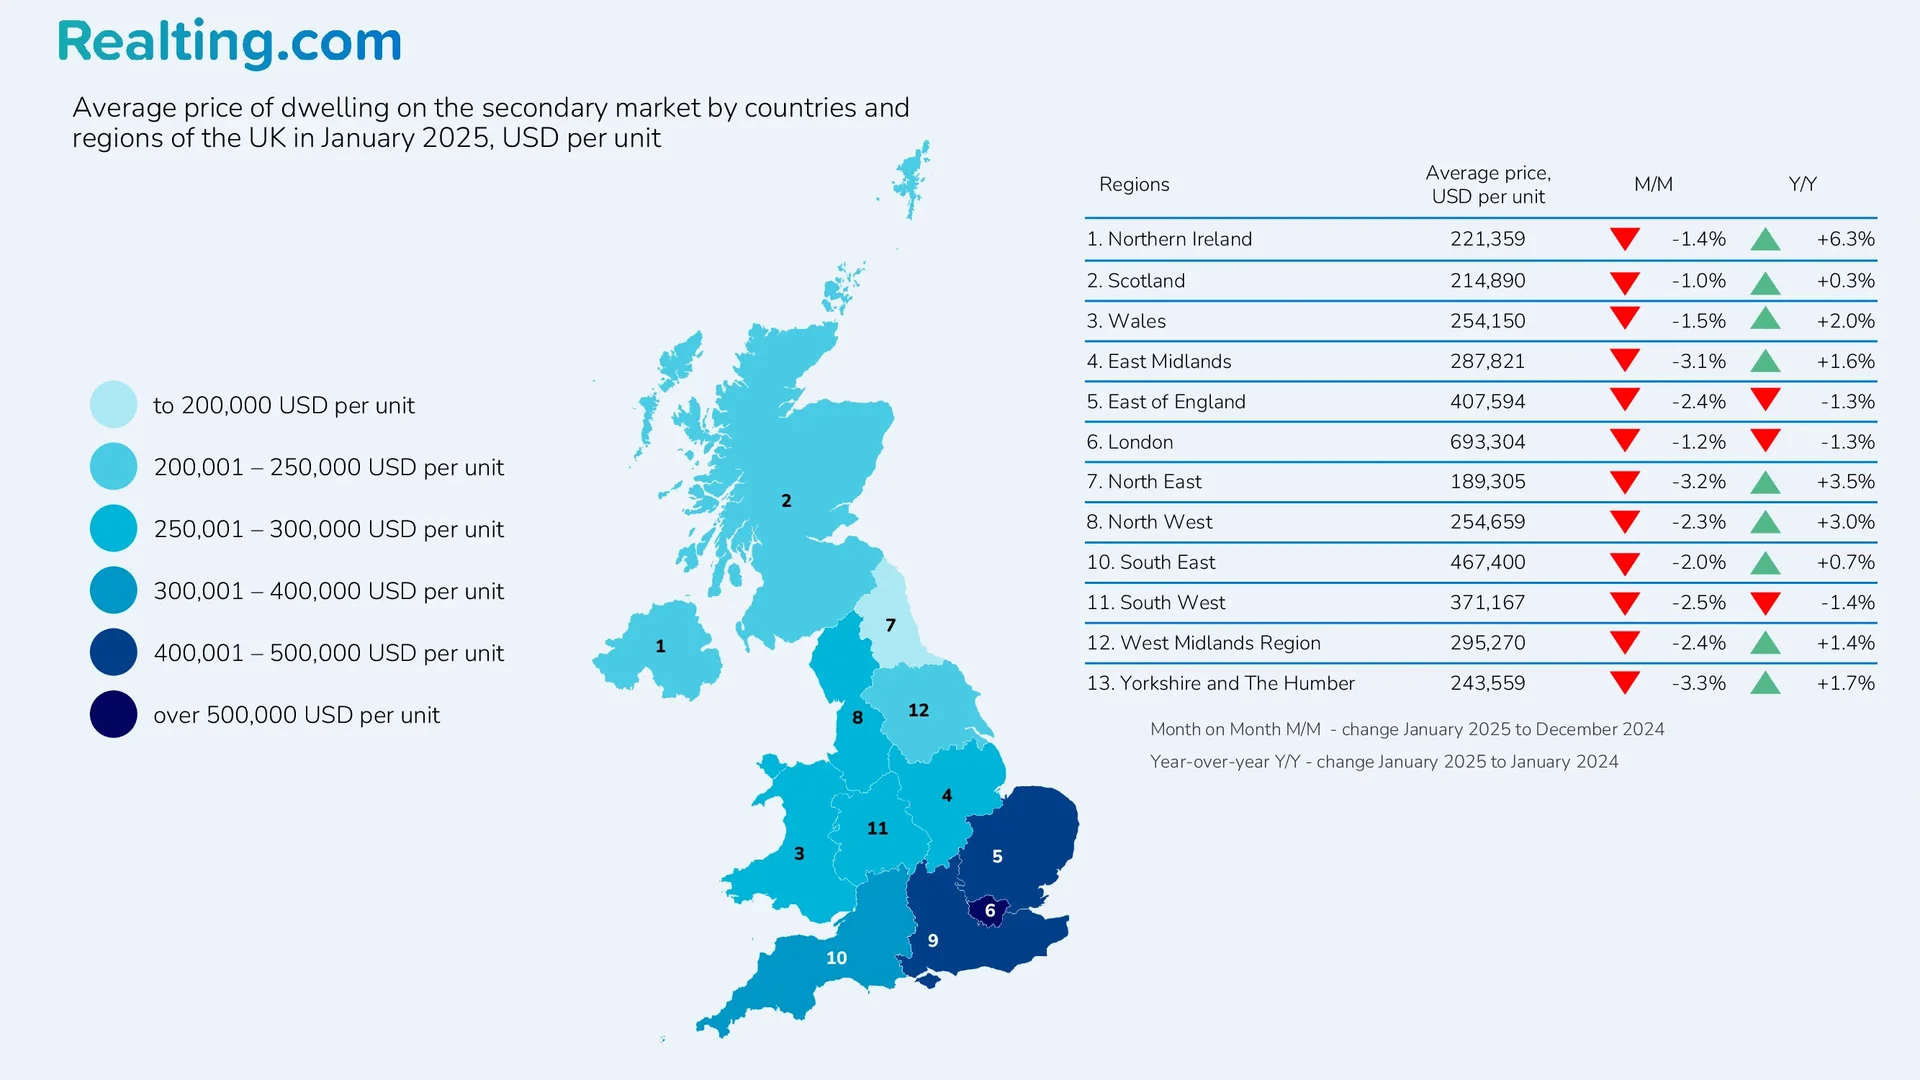
Average prices for residential real estate in purchase and sale transactions
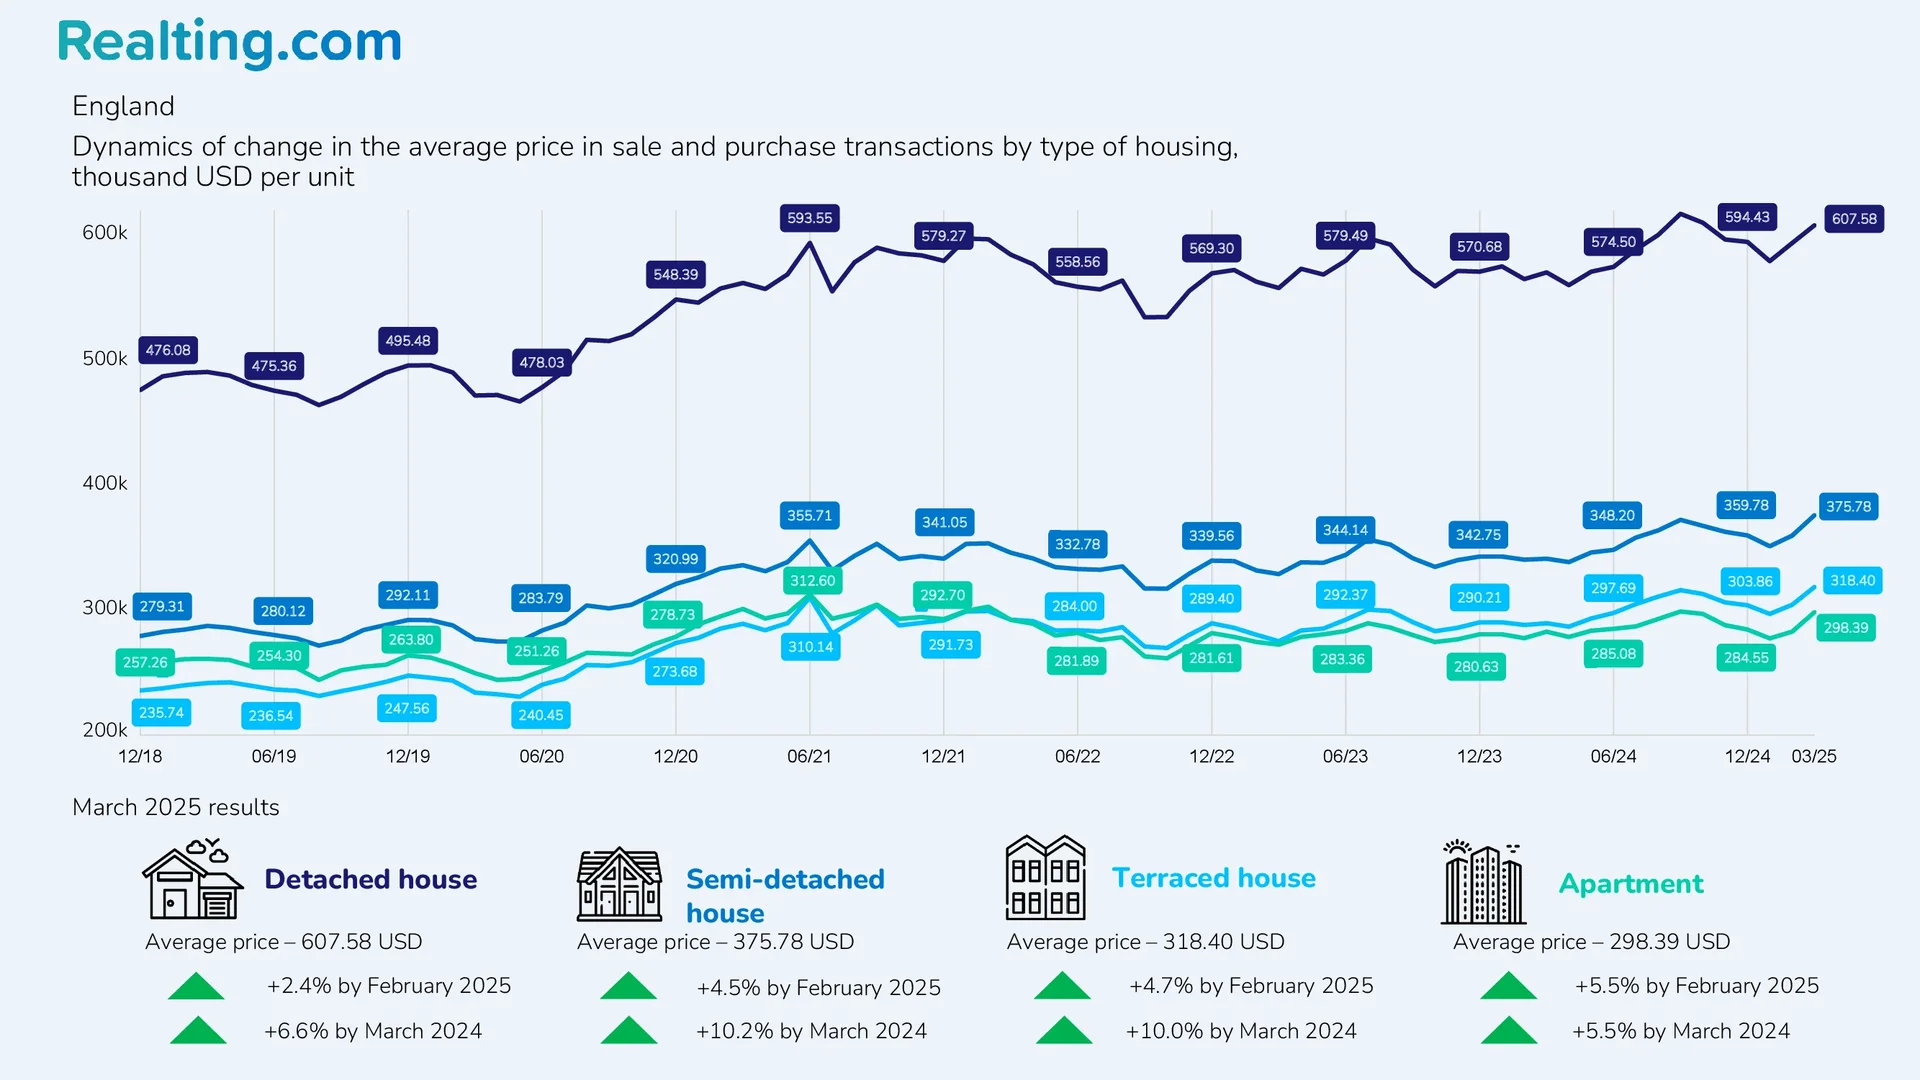
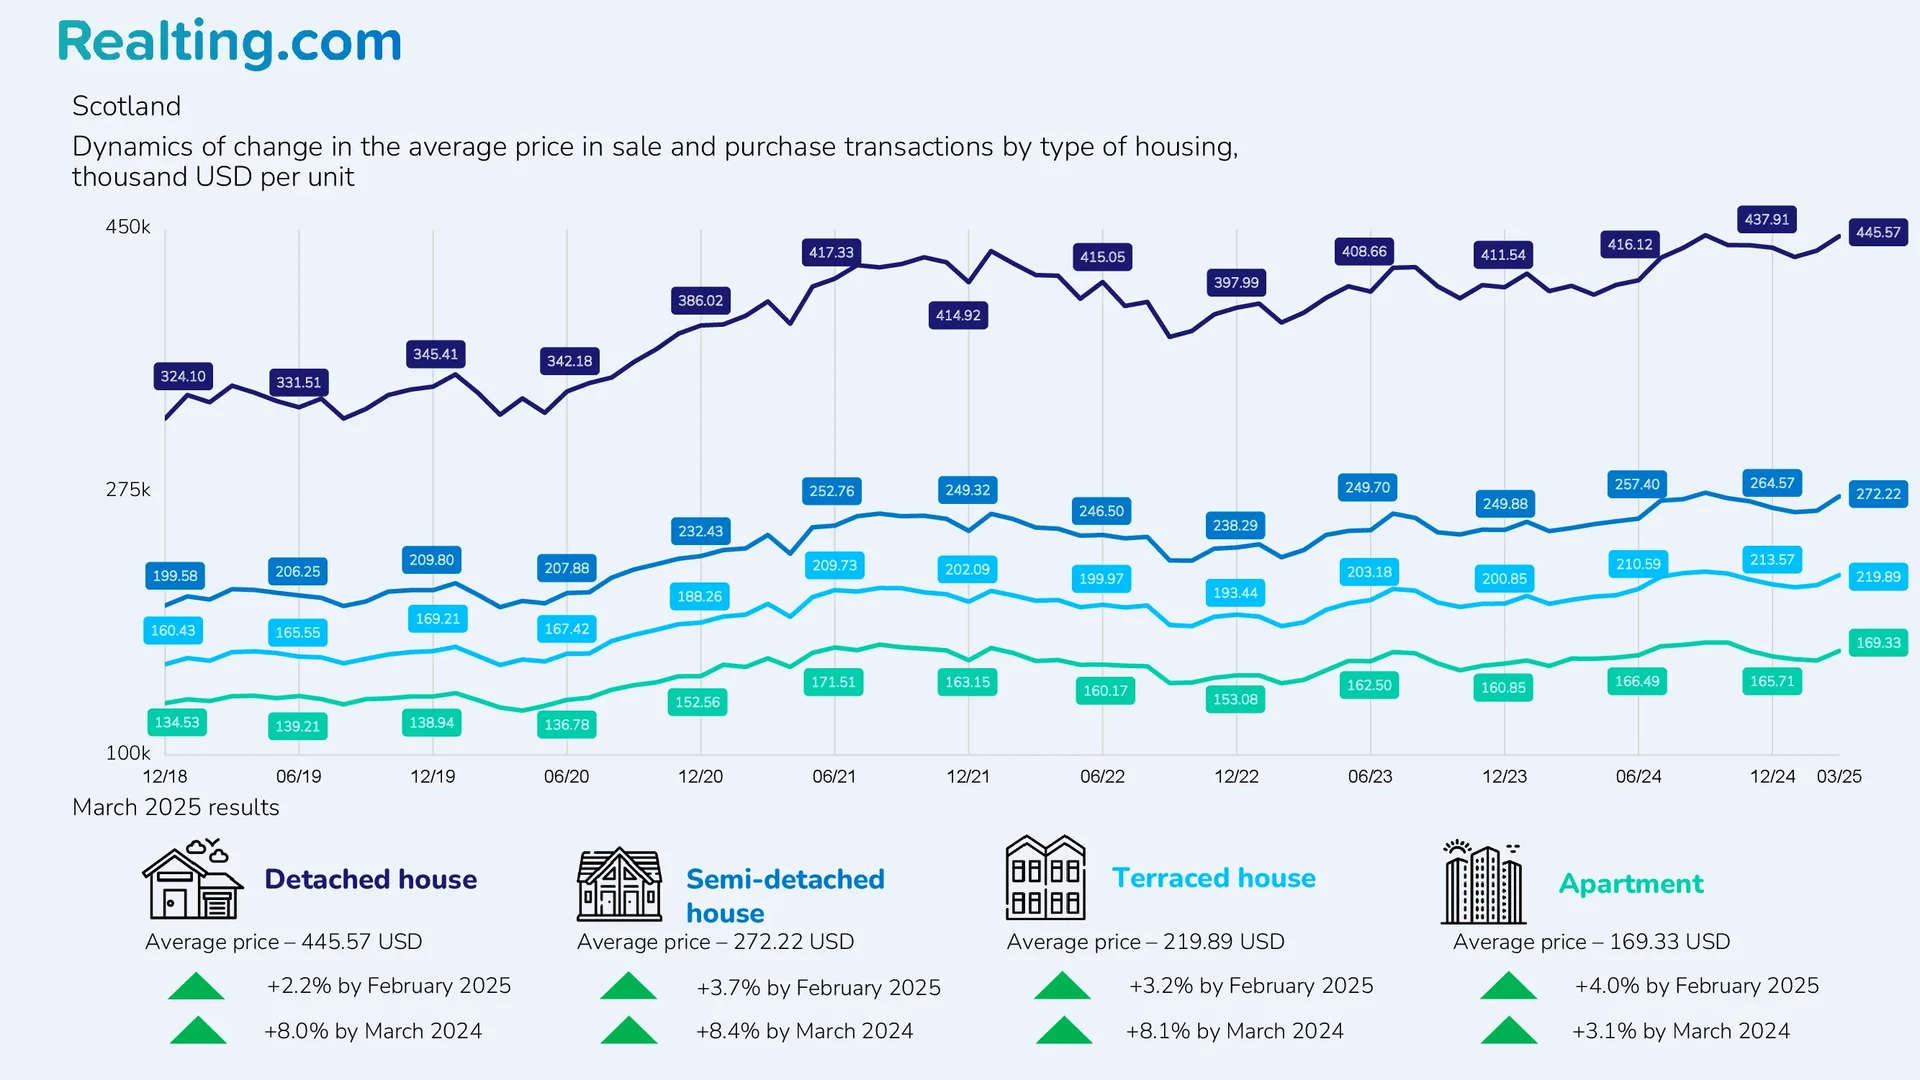
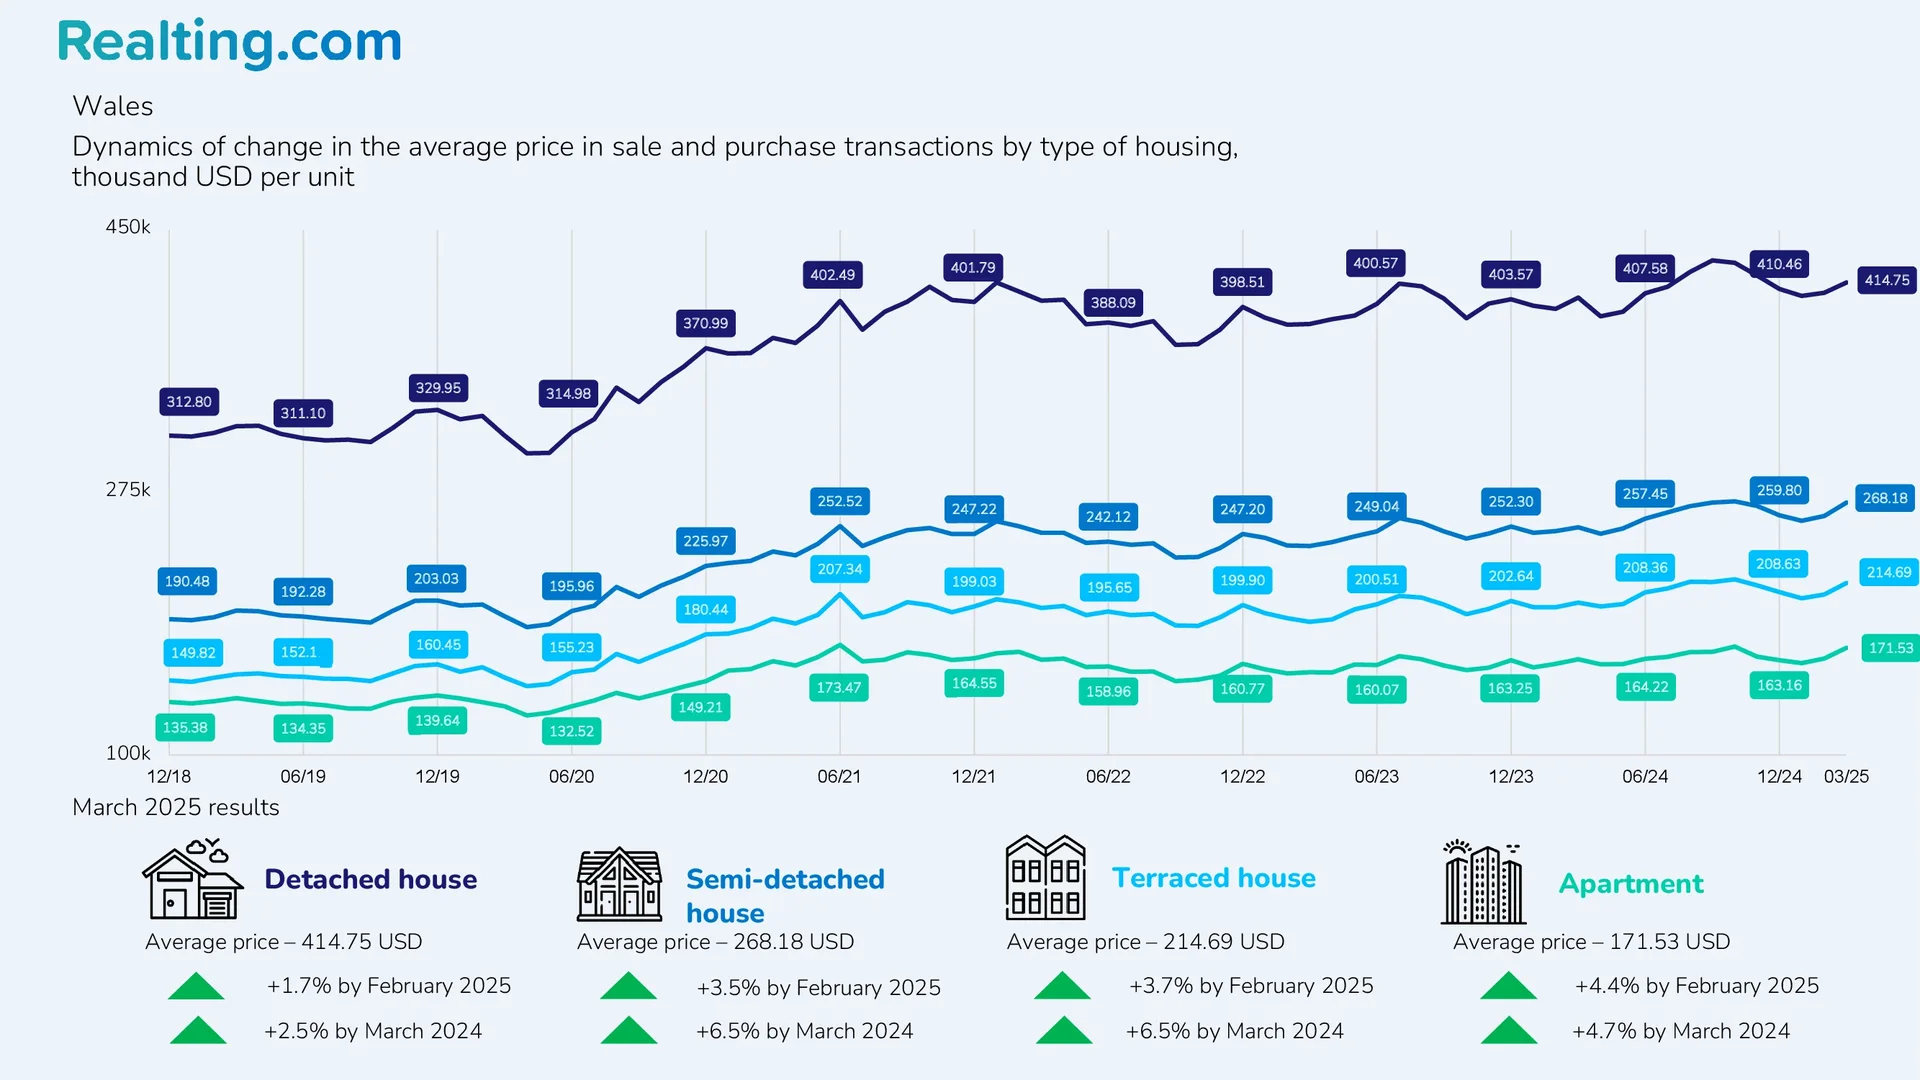
Below are charts showing the dynamics of changes in average house prices in purchase and sale transactions by type of housing in England, Northern Ireland, Scotland, and Wales. Prices are presented in US dollars (USD) per unit of housing, the change in prices in US dollars differs from the change in prices in the national currency of Great Britain — the pound sterling (GBP).
As of March 2025, in all countries of the UK, an increase in average prices for all types of housing was recorded in annual terms. The largest increase was observed in England over the year (change in March 2025 compared to March 2024), average prices, depending on the type of housing, added 5.5% — 10.2%.
Prices increased the least in Wales. Over the year, prices increased by 2.5%—6.5%, depending on the type of residential property.
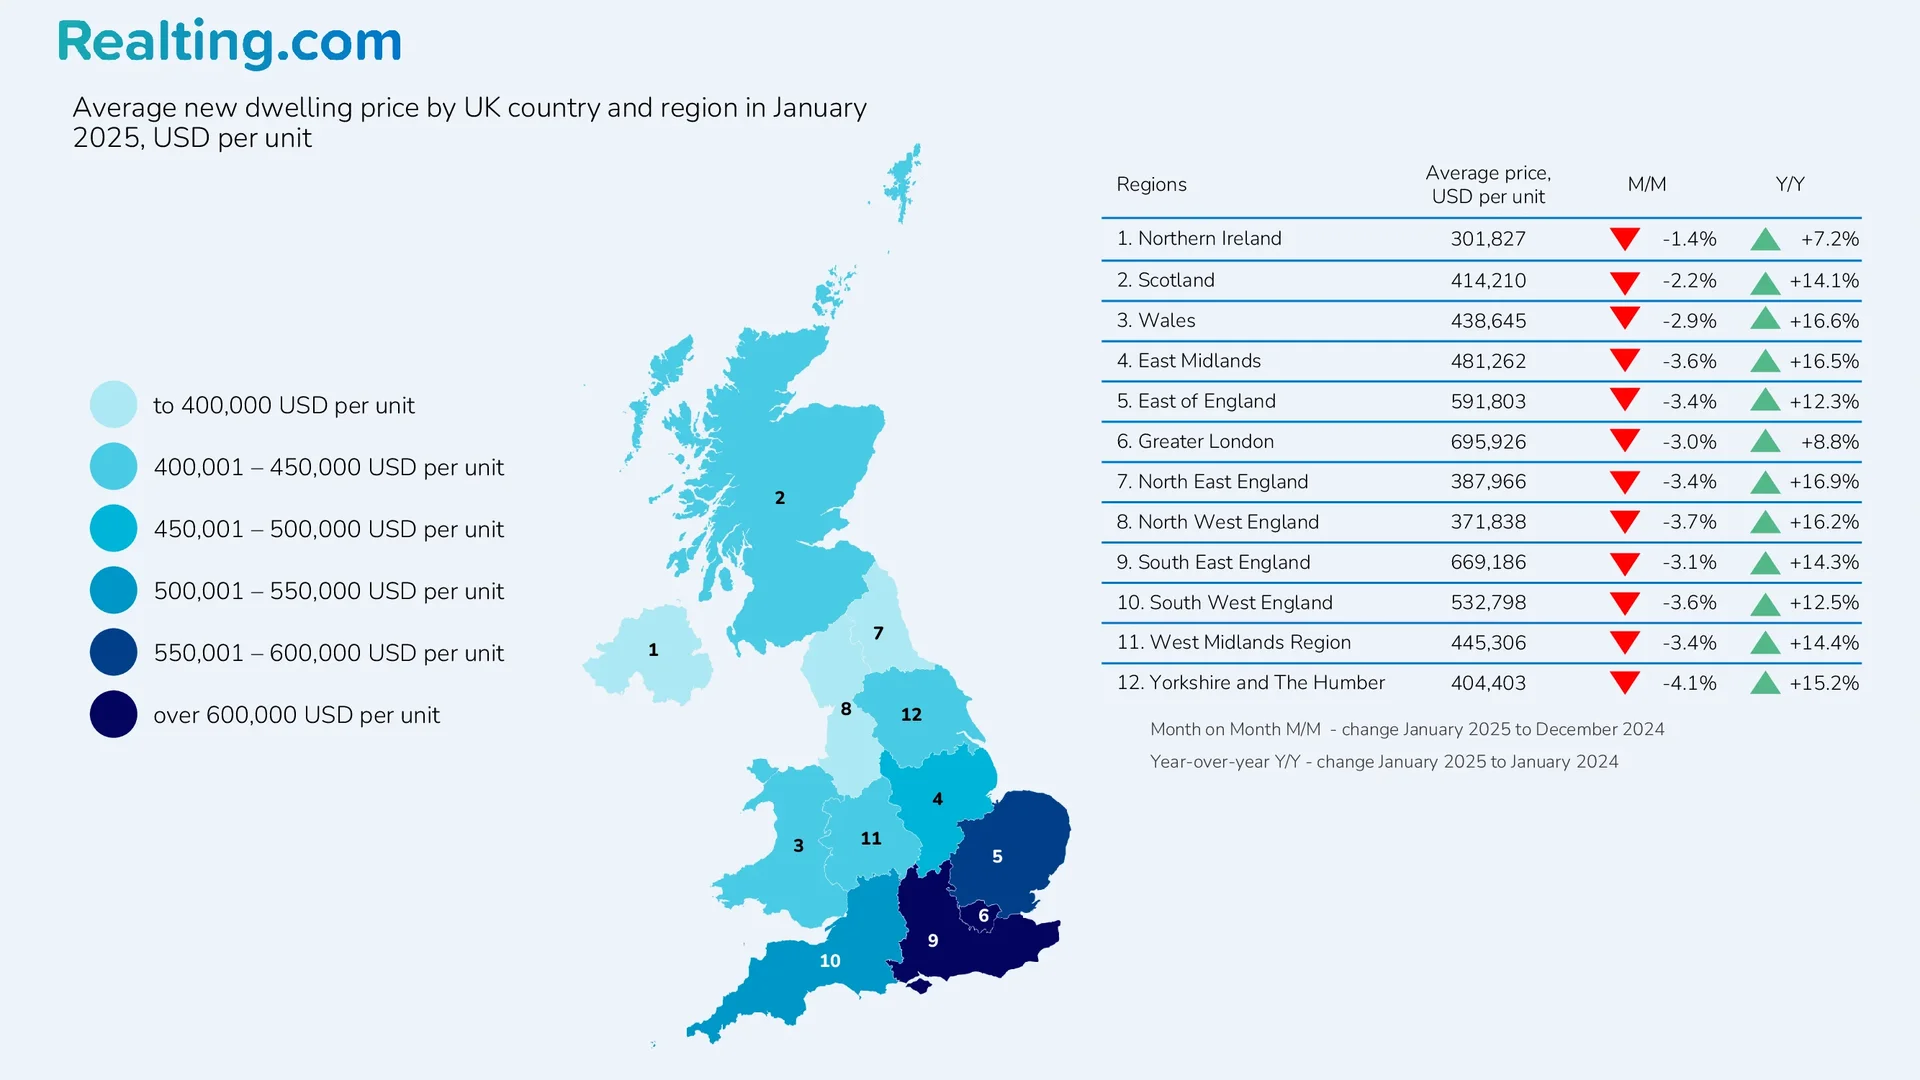
Below are maps of the average price of new and resale homes by country and region in the UK. The maps are based on average house prices in the UK from HM Land Registry (HM Land Registry).
London is one of the most expensive cities in the world, and the prices of apartments in the capital of Great Britain fully justify this statement. London is divided into 3 zones: London City, Inner London, and Outer London.
London City is the historical center of London. London City occupies a tiny area compared to Outer and Inner London. London City is the main business and financial center of Great Britain and, at the same time, one of the main financial centers of the world. The London Stock Exchange and the Bank of England are located here.
Inner London is a part of the districts of the British capital, which form a ring around the City of London and are limited from the outside by Outer London. Outer London is, in turn, a part of the districts, as you might guess, which form a ring around Inner London. Together, Inner London, Outer London, and London City form Greater London.
Below are the dynamics of the change in the average price of apartments in purchase and sale transactions in London City, Outer, and Inner London. Prices are presented both in the national currency of Great Britain and in US dollars.
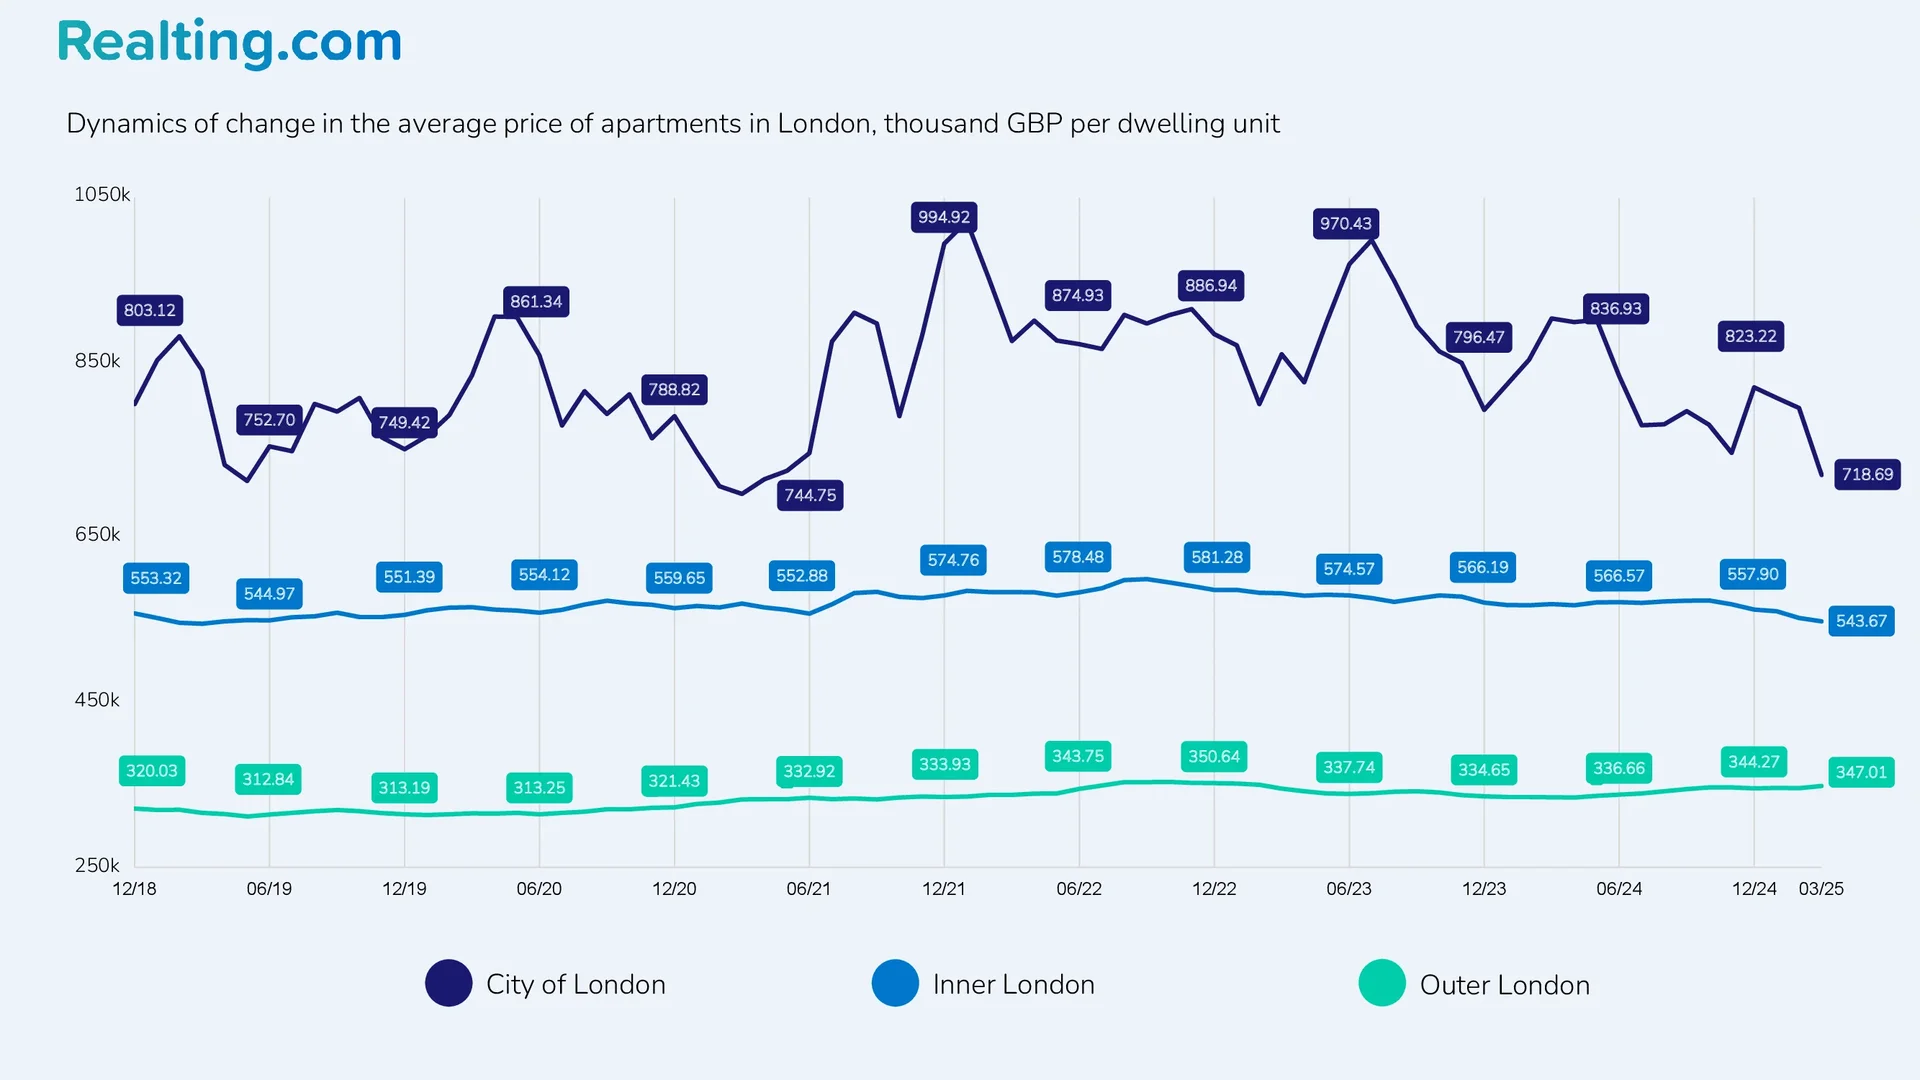
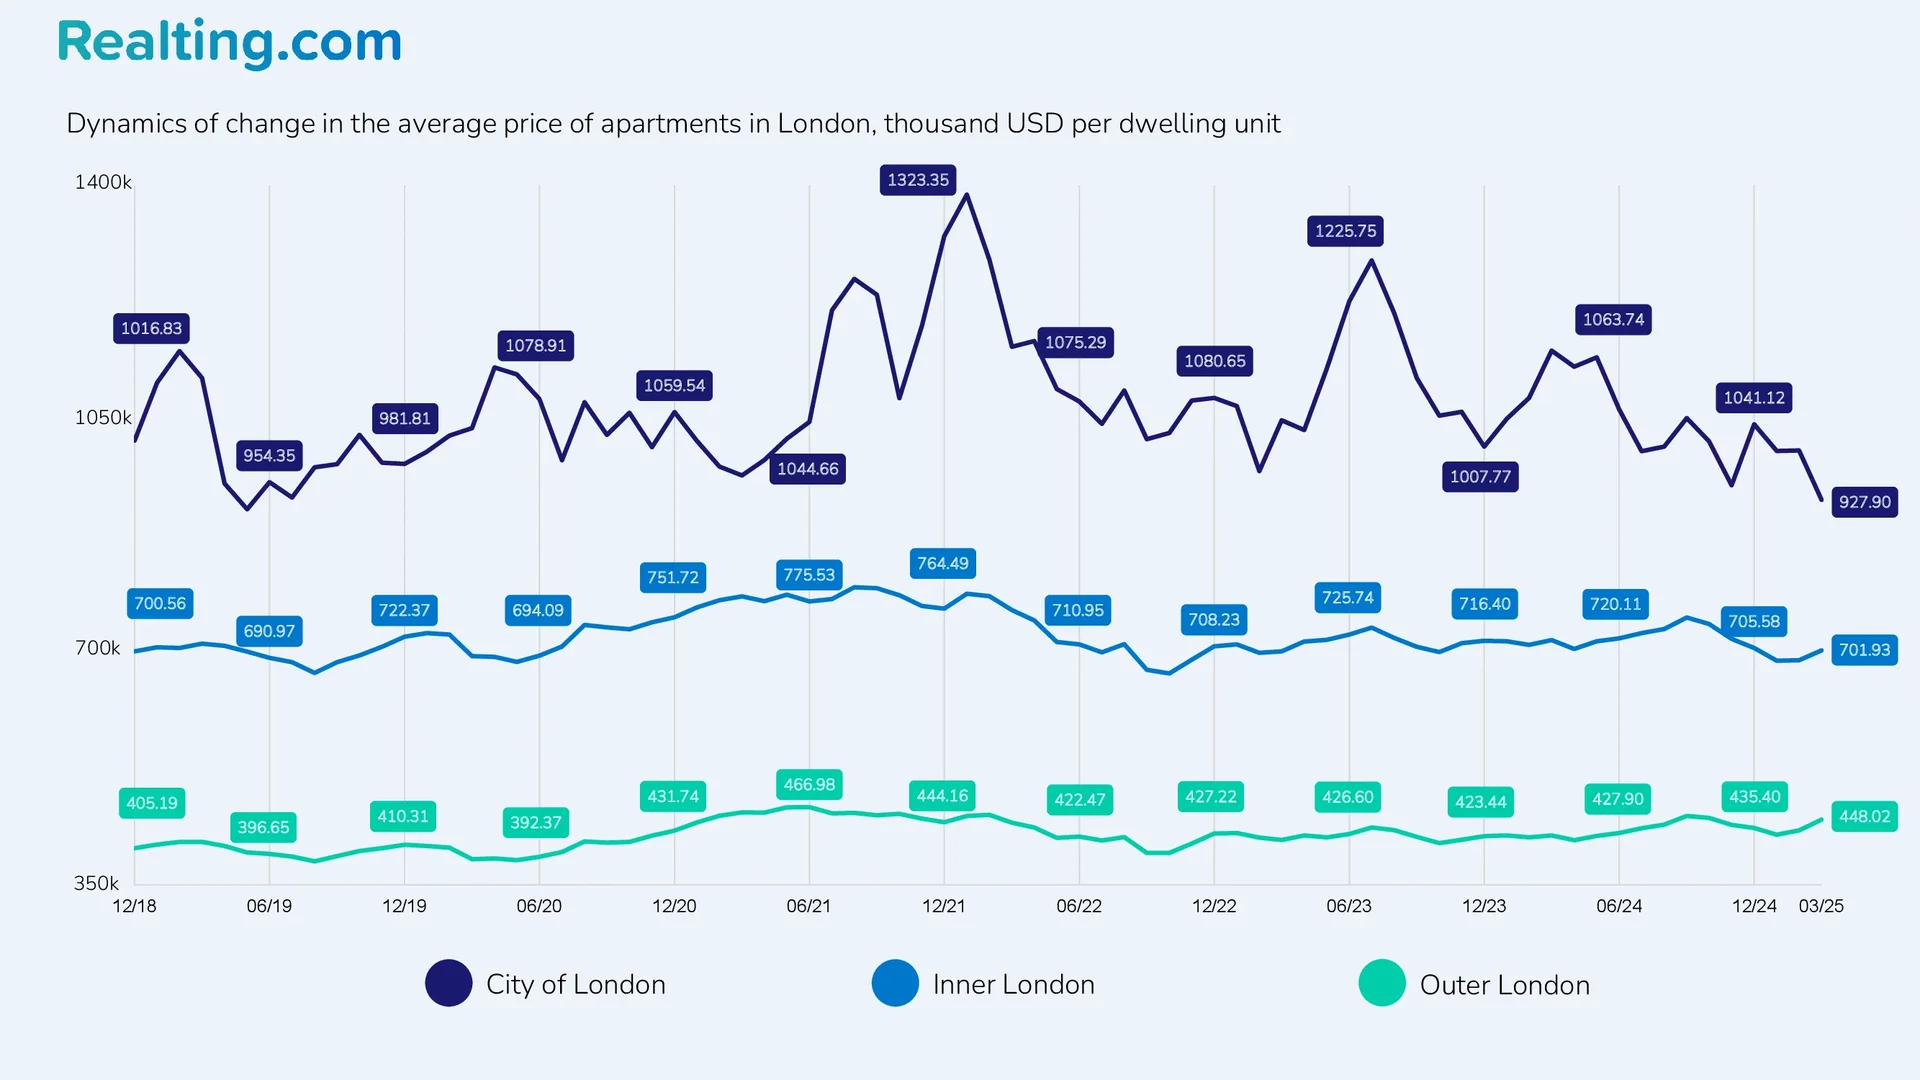
The cost of apartments in London City easily exceeds 1 million US dollars. It is worth noting that the London City market is quite limited: in 2024, only 194 transactions were registered there, and 152 transactions in 2023. The London City residential property market does not reflect the London market. It is a market that is designed for very wealthy people and various companies that buy and rent temporary housing for their employees. In London City, there is no such thing as a permanent demand for housing; at the same time, there are no market trends. Almost all the housing that is presented in London City is marked as “elite.”
In Inner London in 2024, 29,305 residential sales transactions were registered, while in Outer London, the number of residential sales was 42,437. In general, the residential property markets of both Outer and Inner London are subject to similar trends.
The average price of flats in Inner London in March 2025 was USD 701,934, down 2.2% from March 2024. In terms of national currency, the average price was GBP 543,671, down 3.7% from March 2024.
In Outer London, the average price of flats in March 2025 was USD 448,019, up 5.6% from a year ago. In British pounds, the average price of flats increased by 4% over the year to GBP 347,006.
Let’s Sum Up
The first quarter of 2025 was a turning point for the UK property market. The expectation of an increase in stamp duty from April led to a record increase in sales by 49% compared to the same period in 2024. Buyers rushed to complete transactions en masse before the new tax rules came into force, which significantly increased the cost of purchasing a home. For the average buyer, the tax rose from £2,082 to £4,582.
However, this surge in activity is temporary. A significant decline in sales is expected in the future, since most potential buyers have already implemented their plans. Combined with high mortgage interest rates and overall growth in house prices, the new tax conditions create additional barriers for buyers. The market can only recover if mortgage rates decrease and participants adapt to the new tax realities.