Top 10 States in America with the Cheapest and Most Expensive Real Estate
REALTING has compiled a ranking of states with the most expensive and cheapest USA residential real estate as of September 2025. To provide a deeper understanding of housing prices in this country, we also include maps showing observed prices in counties and metropolitan areas across the United States.
Housing cost data in the US was sourced from the FRED (Federal Reserve Economic Data) portal, created and maintained by the research department of the Federal Reserve Bank of St. Louis. We used data on the median price per square foot in residential real estate listings for specific geographic regions (state, county, metropolitan area). For better clarity, we’ve added information on the cost per square meter, as well as price changes compared to September of the previous year and 2020.
Top 10 States with the Lowest Housing Prices
As of September 2025, the list of states where housing is the most affordable looks as follows:
|
State |
Median price, USD/sq ft |
Median price, USD/sq m |
Y25/Y24* |
Y25/Y20* |
|
1. West Virginia (WV) |
144 |
1550.00 |
+5.11% |
+54.84% |
|
2. Mississippi (MS) |
148 |
1593.06 |
0.00% |
+40.95% |
|
3. Kansas (KS) |
151 |
1625.35 |
+0.67% |
+52.53% |
|
4. Louisiana (LA) |
152 |
1636.11 |
0.00% |
+20.63% |
|
5. Indiana (IN) |
157 |
1689.93 |
+2.61% |
+44.04% |
|
6. Oklahoma (OK) |
161 |
1732.99 |
+1.26% |
+41.23% |
|
7. Arkansas (AR) |
162 |
1743.75 |
+4.52% |
+54.29% |
|
8. North Dakota (ND) |
164 |
1765.28 |
+0.61% |
+43.86% |
|
9. Alabama (AL) |
166 |
1786.81 |
+1.22% |
+40.68% |
|
10. Ohio (OH) |
166 |
1786.81 |
+3.75% |
+49.55% |
*Y25/Y24 — Change in median price per square foot in housing listings in September 2025 compared to September 2024.
Y25/Y20 — Change in median price per square foot in housing listings in September 2025 compared to September 2020.
Top 10 States with the Highest Housing Prices
Here are the top 10 states with the most expensive cost per square foot (and consequently per square meter) for housing:
|
State |
Median price, USD/sq ft |
Median price, USD/sq m |
Y25/Y24* |
Y25/Y20* |
|
1. Hawaii (HI) |
698 |
7513.20 |
-2.65% |
+18.51% |
|
2. District of Columbia (DC) |
489 |
5263.55 |
-4.12% |
-16.27% |
|
3. California (CA) |
460 |
4951.39 |
-2.54% |
+11.92% |
|
4. Massachusetts (MA) |
430 |
4628.48 |
+0.47% |
+28.36% |
|
5. New York (NY) |
397 |
4273.27 |
+4.47% |
+29.74% |
|
6. Washington (WA) |
341 |
3670.49 |
-0.58% |
+30.65% |
|
7. Rhode Island (RI) |
333 |
3584.38 |
+3.42% |
+31.62% |
|
8. Montana (MT) |
319 |
3433.68 |
-0.93% |
+67.02% |
|
9. New Hampshire (NH) |
312 |
3358.34 |
+3.31% |
+65.08% |
|
10. Oregon (OR) |
305 |
3282.99 |
-0.97% |
+27.08% |
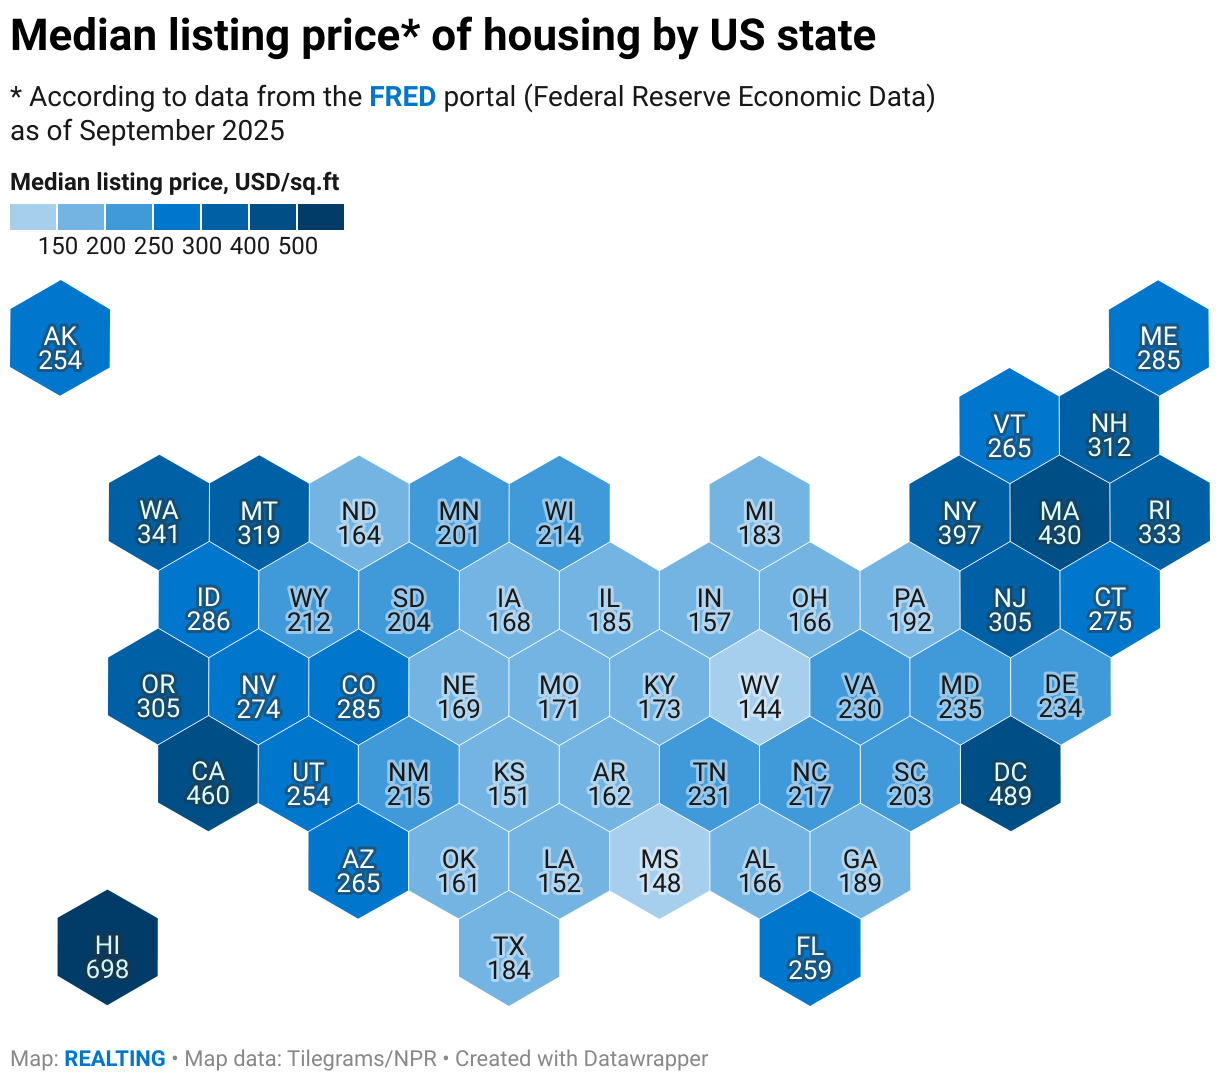
Below is a schematic map of the US showing the median housing price levels across all states.
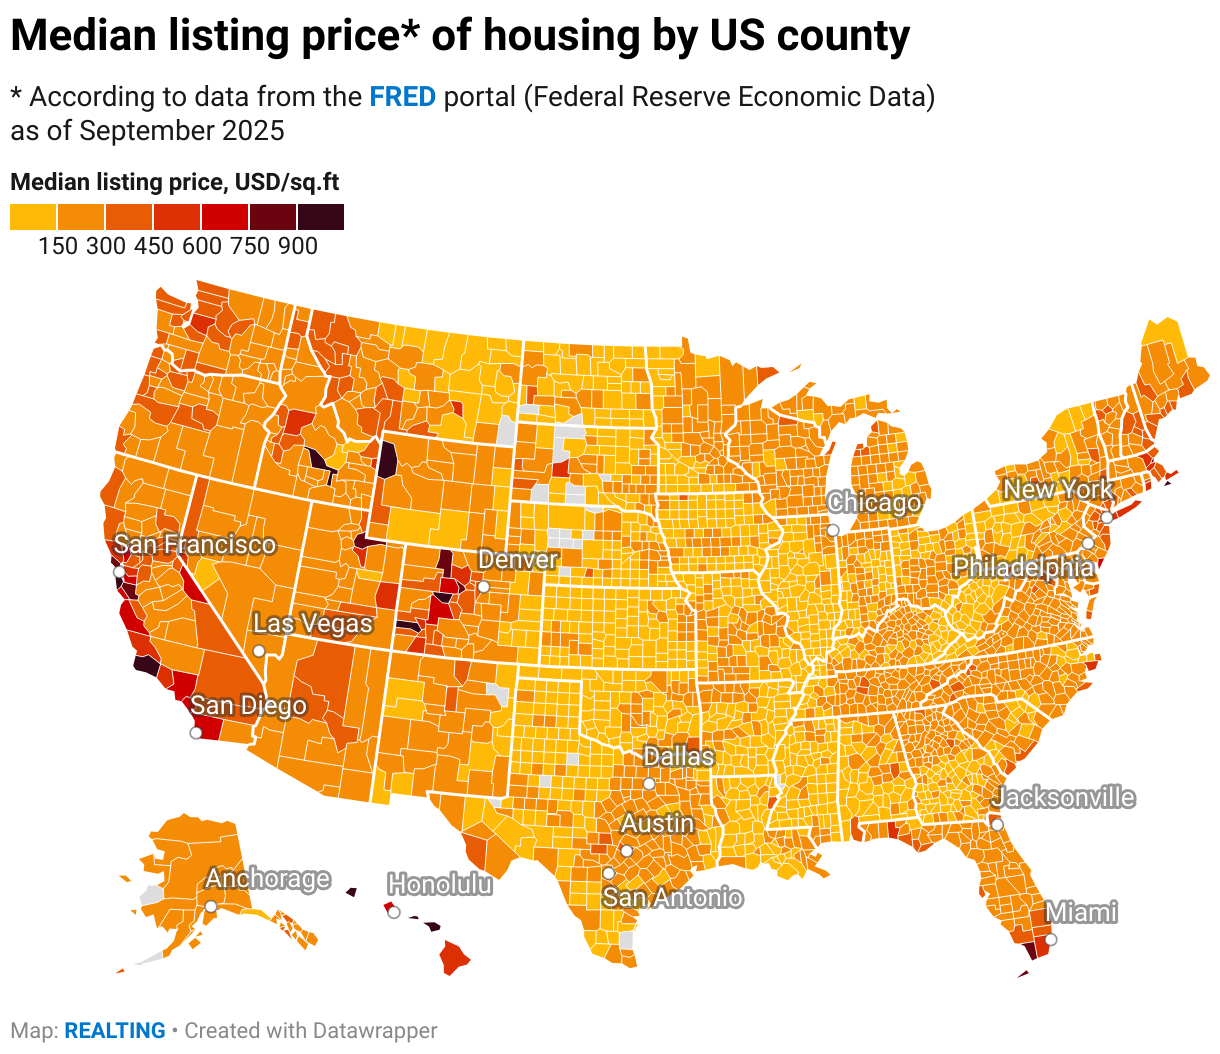
Housing Costs by US Counties
Moving from states to counties: the 50 US states and the District of Columbia contain 3,144 counties and equivalents (independent cities, parishes, and other special units). An additional 100 county equivalents are located in US territories outside the 50 states and DC.
To explore residential real estate costs in specific US counties, we provide an interactive map showing the median listing price by county.
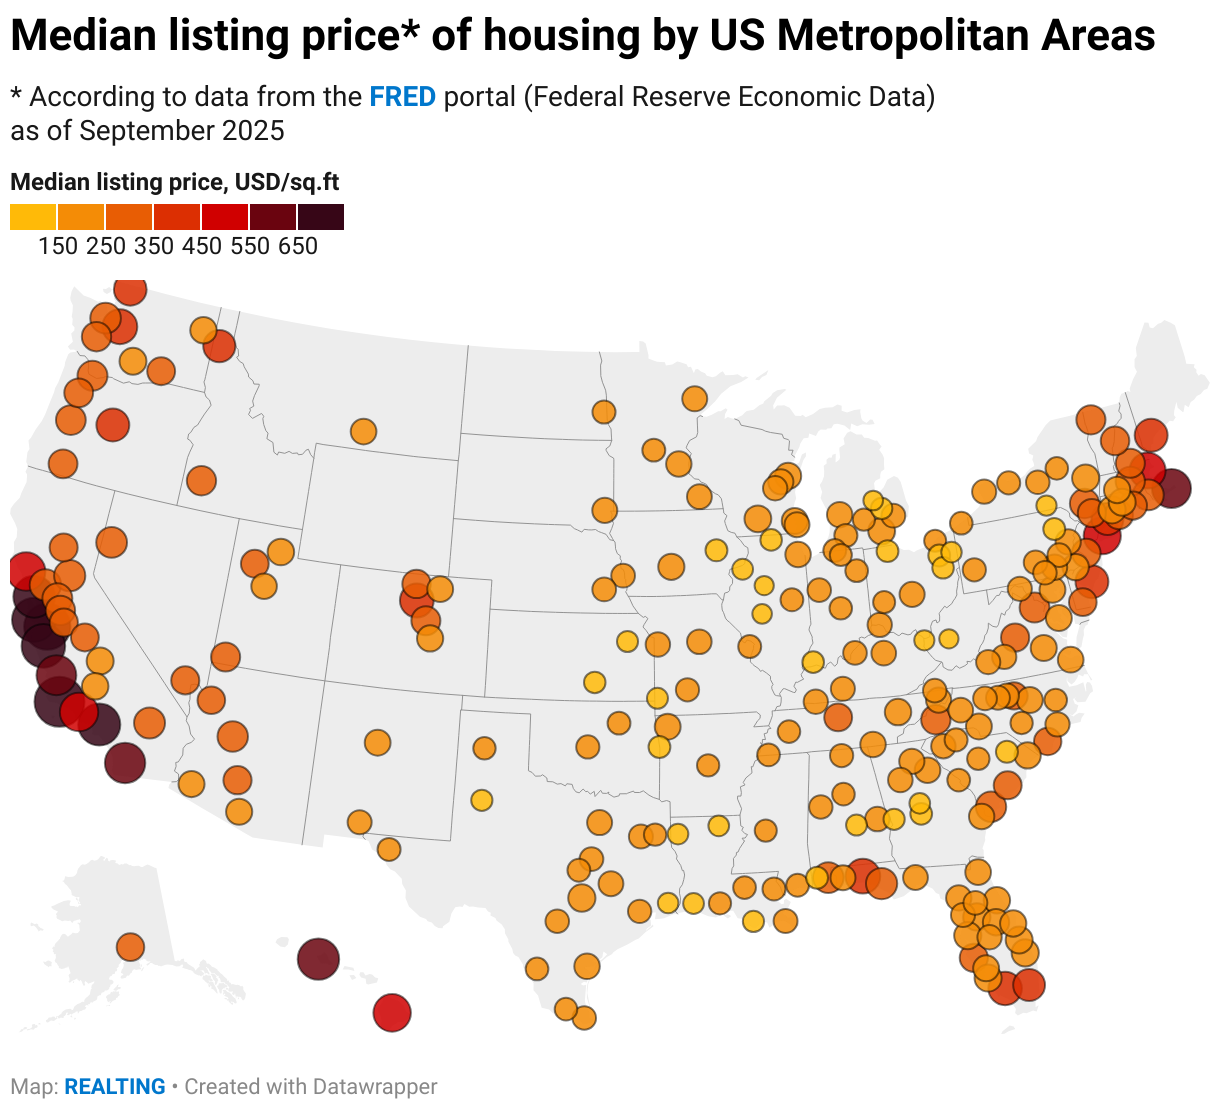
Housing Costs in US Metropolitan Areas
As of September 2025, FRED provides data on median price per square foot for 925 metropolitan areas. Notably, these areas vary significantly in composition — in simple terms, US metropolitan areas may consist of multiple counties (or equivalent units) linked to at least one core (urban center/district) and adjacent counties with high social and economic integration with the core.
For a visual overview of housing prices in US metropolitan areas, below is a map highlighting the 250 largest metropolitan areas in the country.