
Who is Most Often Denied US Visas? Current Statistics of Refusals
The US State Department regularly publishes statistics on visitor visa denials, which include B-1 (business), B-2 (tourism), and B-1/B-2 (combination of both purposes) visas. We publish the top countries whose citizens have the hardest time getting an American visa, and also show what this top was 5 and 10 years ago.
Overall US Nonimmigrant Visa Issuance Statistics for 2024
According to the US State Department, Bureau of Consular Affairs in the USA, by the end of 2024, it processed approximately 14.25 million nonimmigrant visa applications across 80 different categories, which is 10.3% more than it processed in 2023.
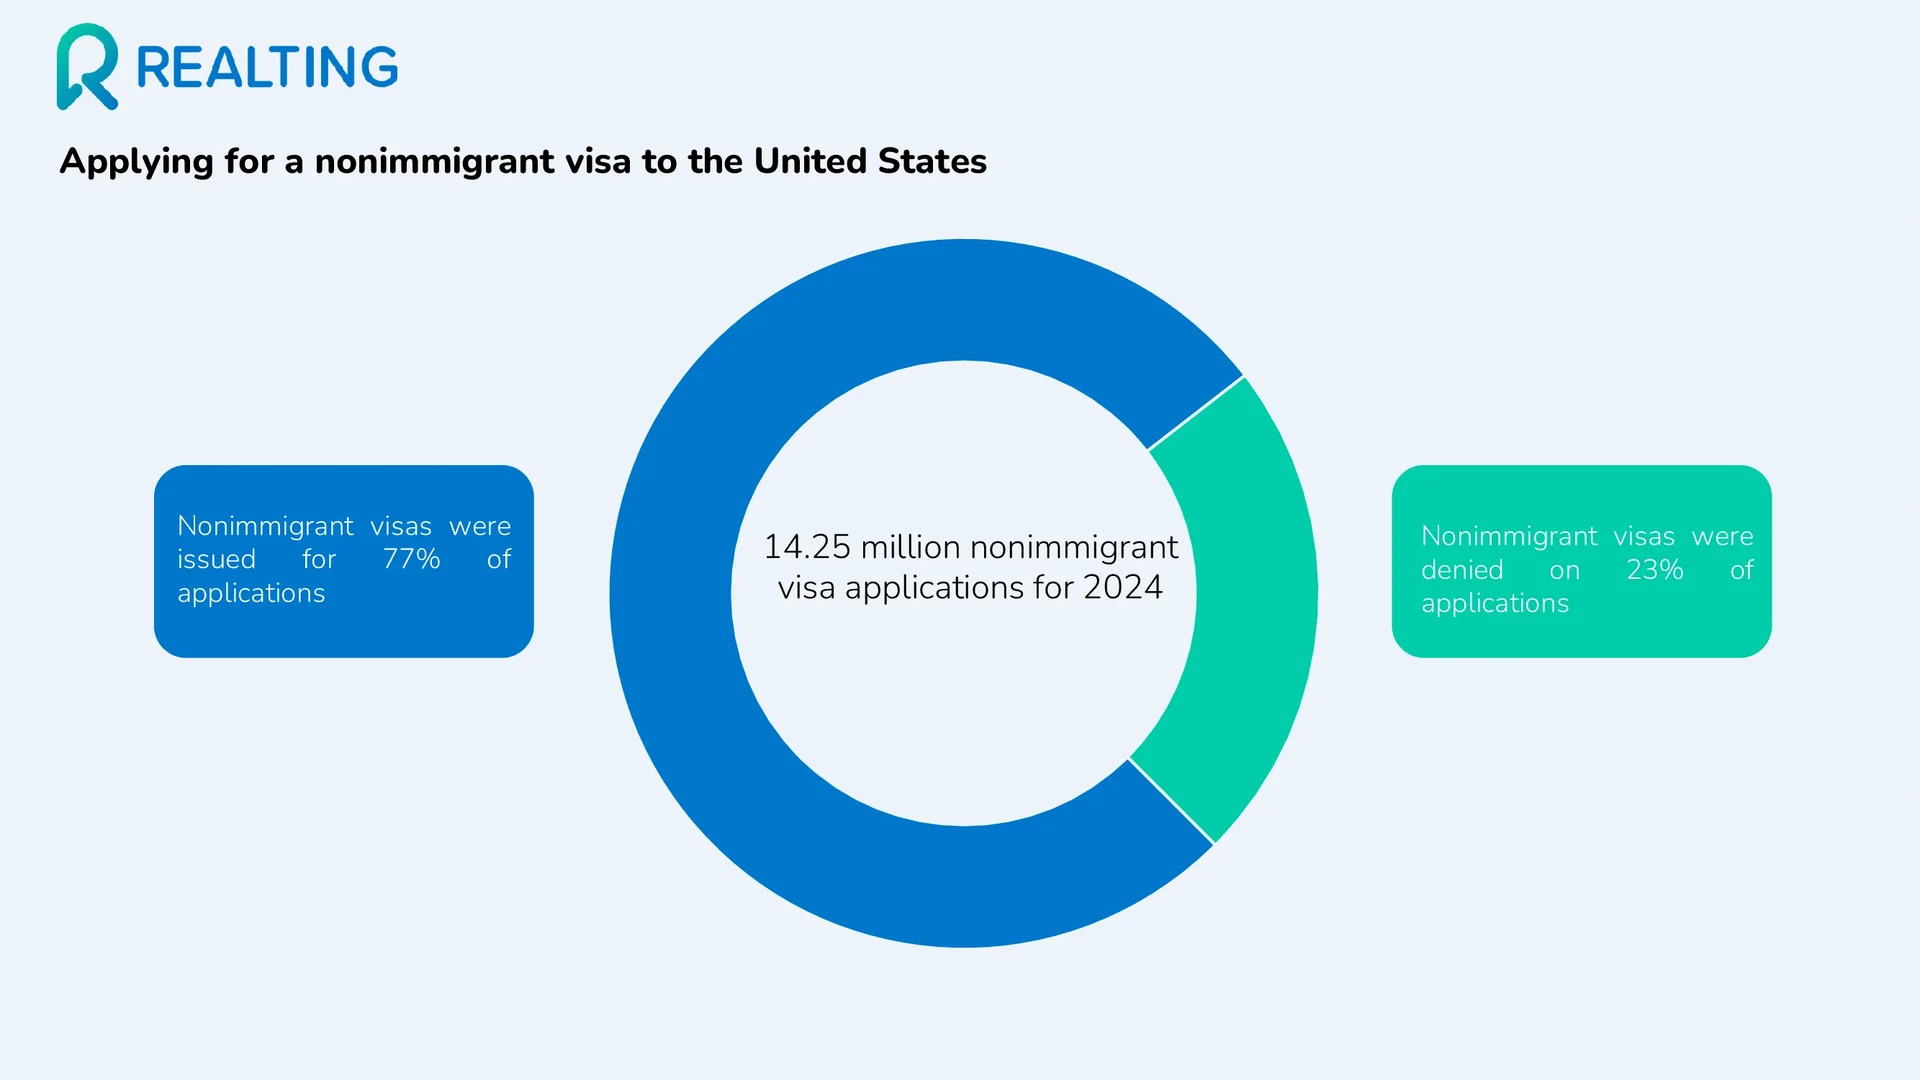
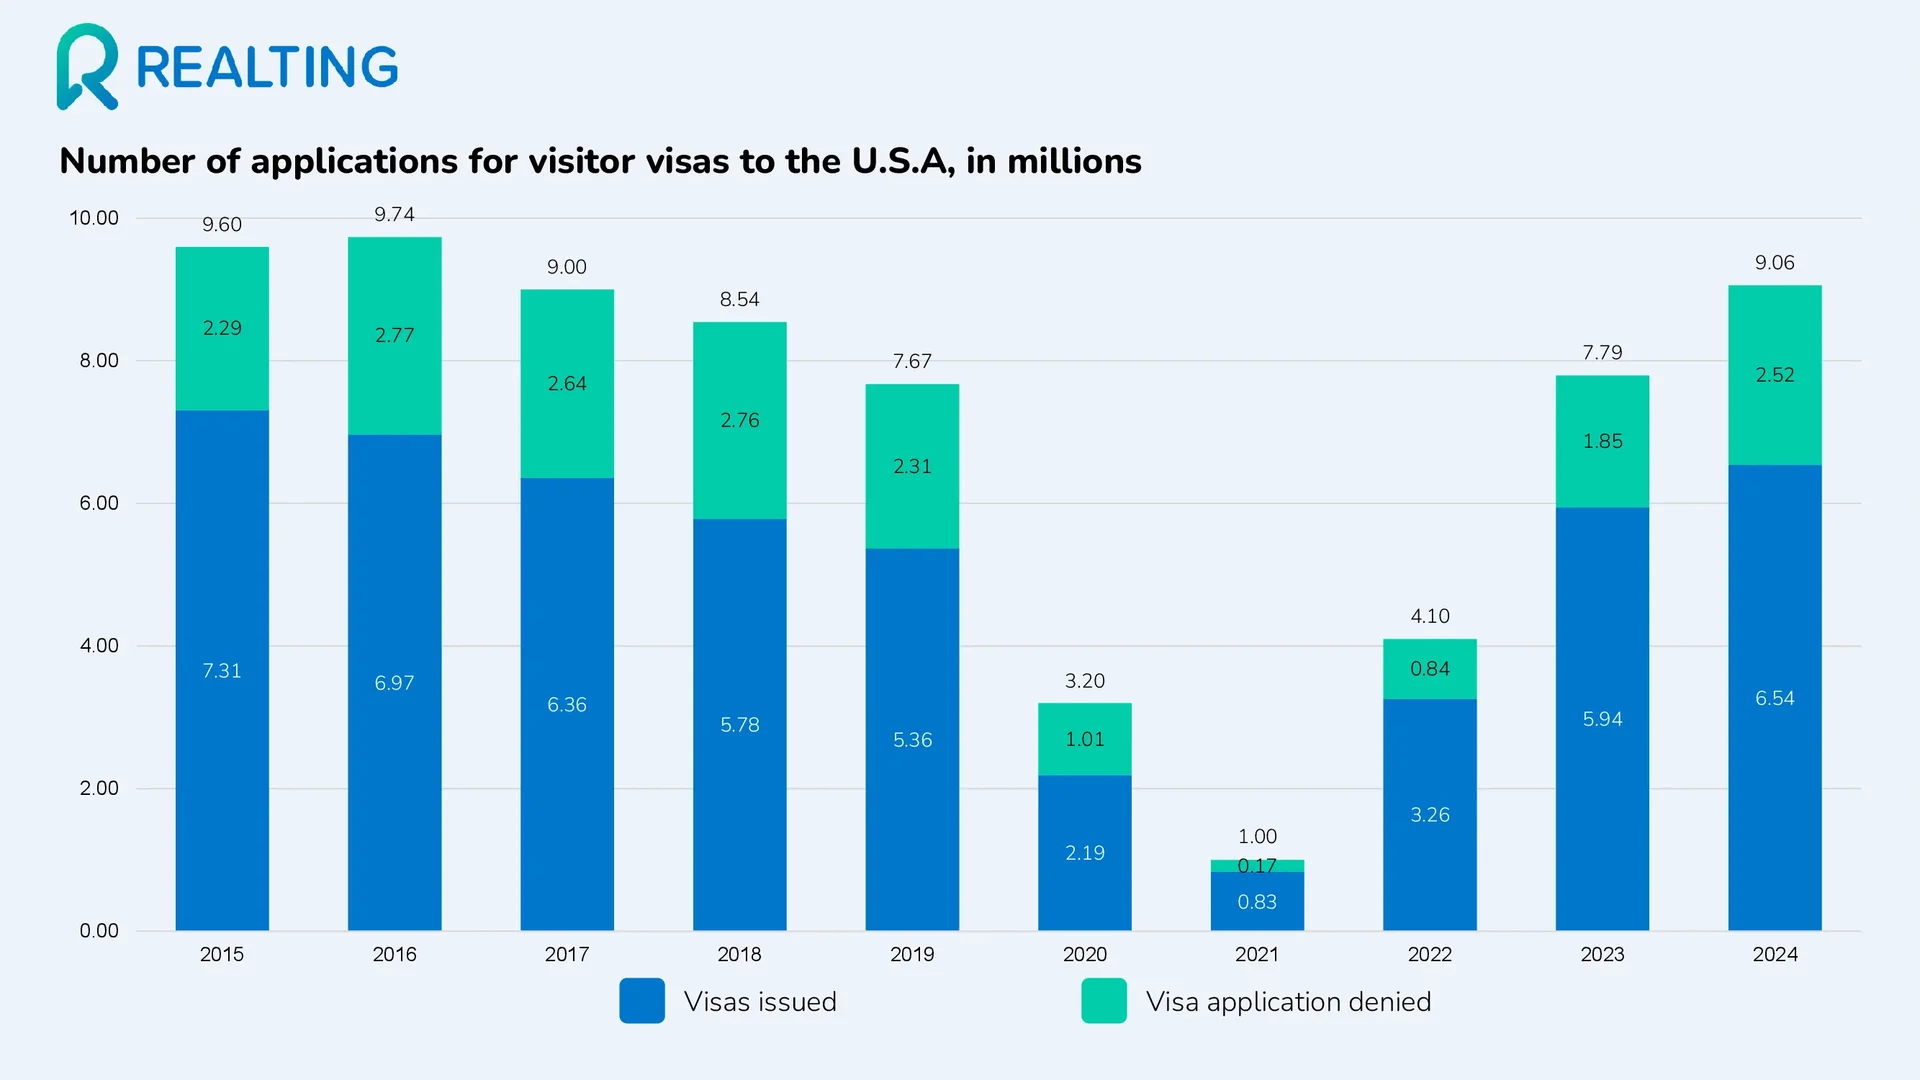
Visitor visa categories (B-1, B-2, B-1/B-2) accounted for 63.6% of all U.S. nonimmigrant visa applications processed, or 9.06 million applications, an increase of 16.2% over the 2023 total.
In 2024, the visitor visa refusal rate was 27.8% (2.52 million visa applications were refused). It is worth noting that over the past 10 years, the lowest visitor visa refusal rate was in 2021, at 16.8%; since 2021, the visitor visa refusal rate has been increasing annually.
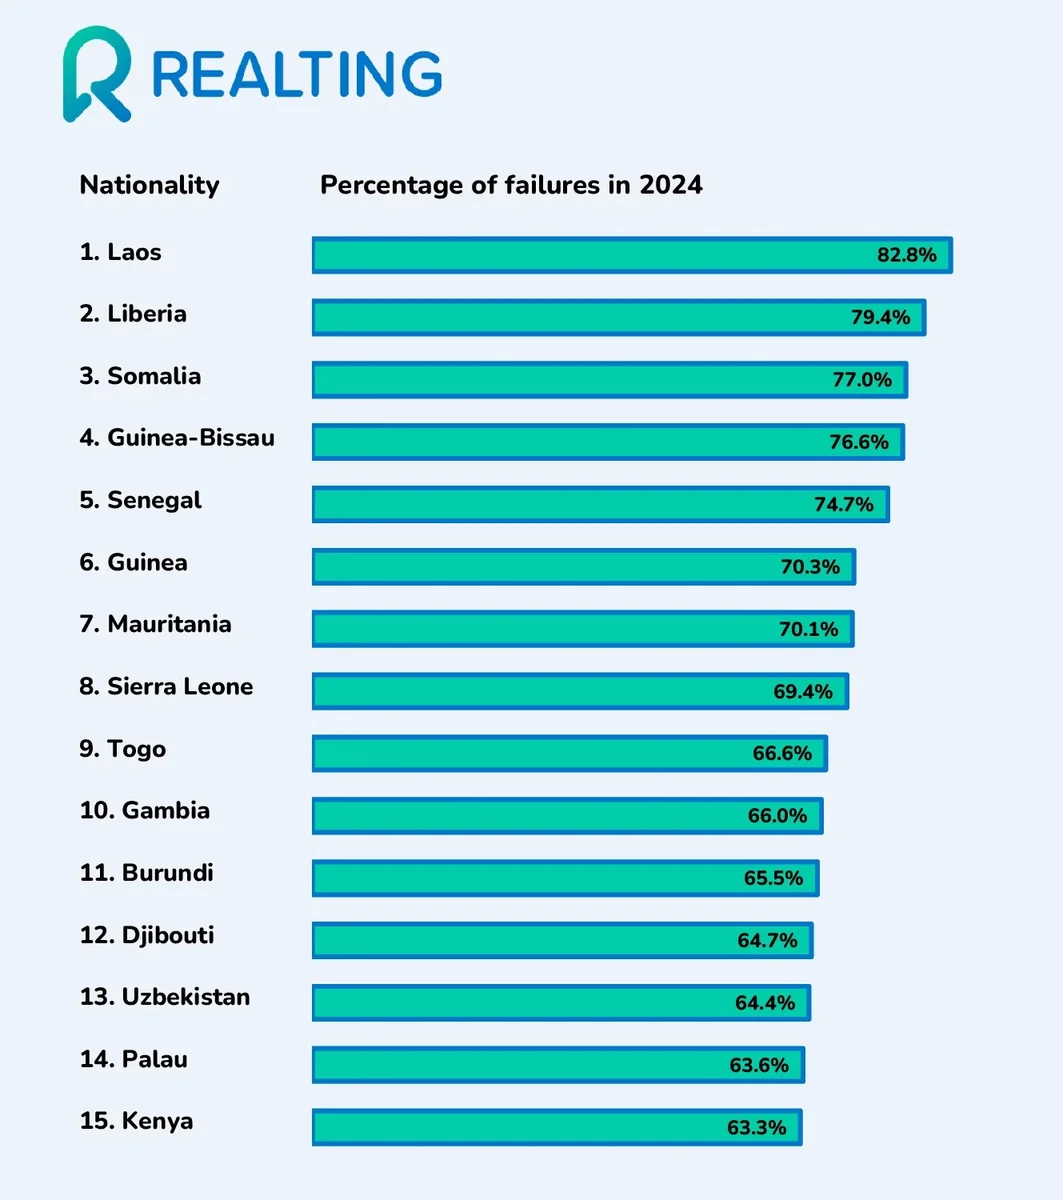
Top Countries with the Highest Failure Rates in 2024
Citizens of which countries received the highest percentage* of US visitor visa denials by the end of 2024.
Citizens of which countries had the highest percentage* of US visitor visa denials in 2023, 2020, and 2015.
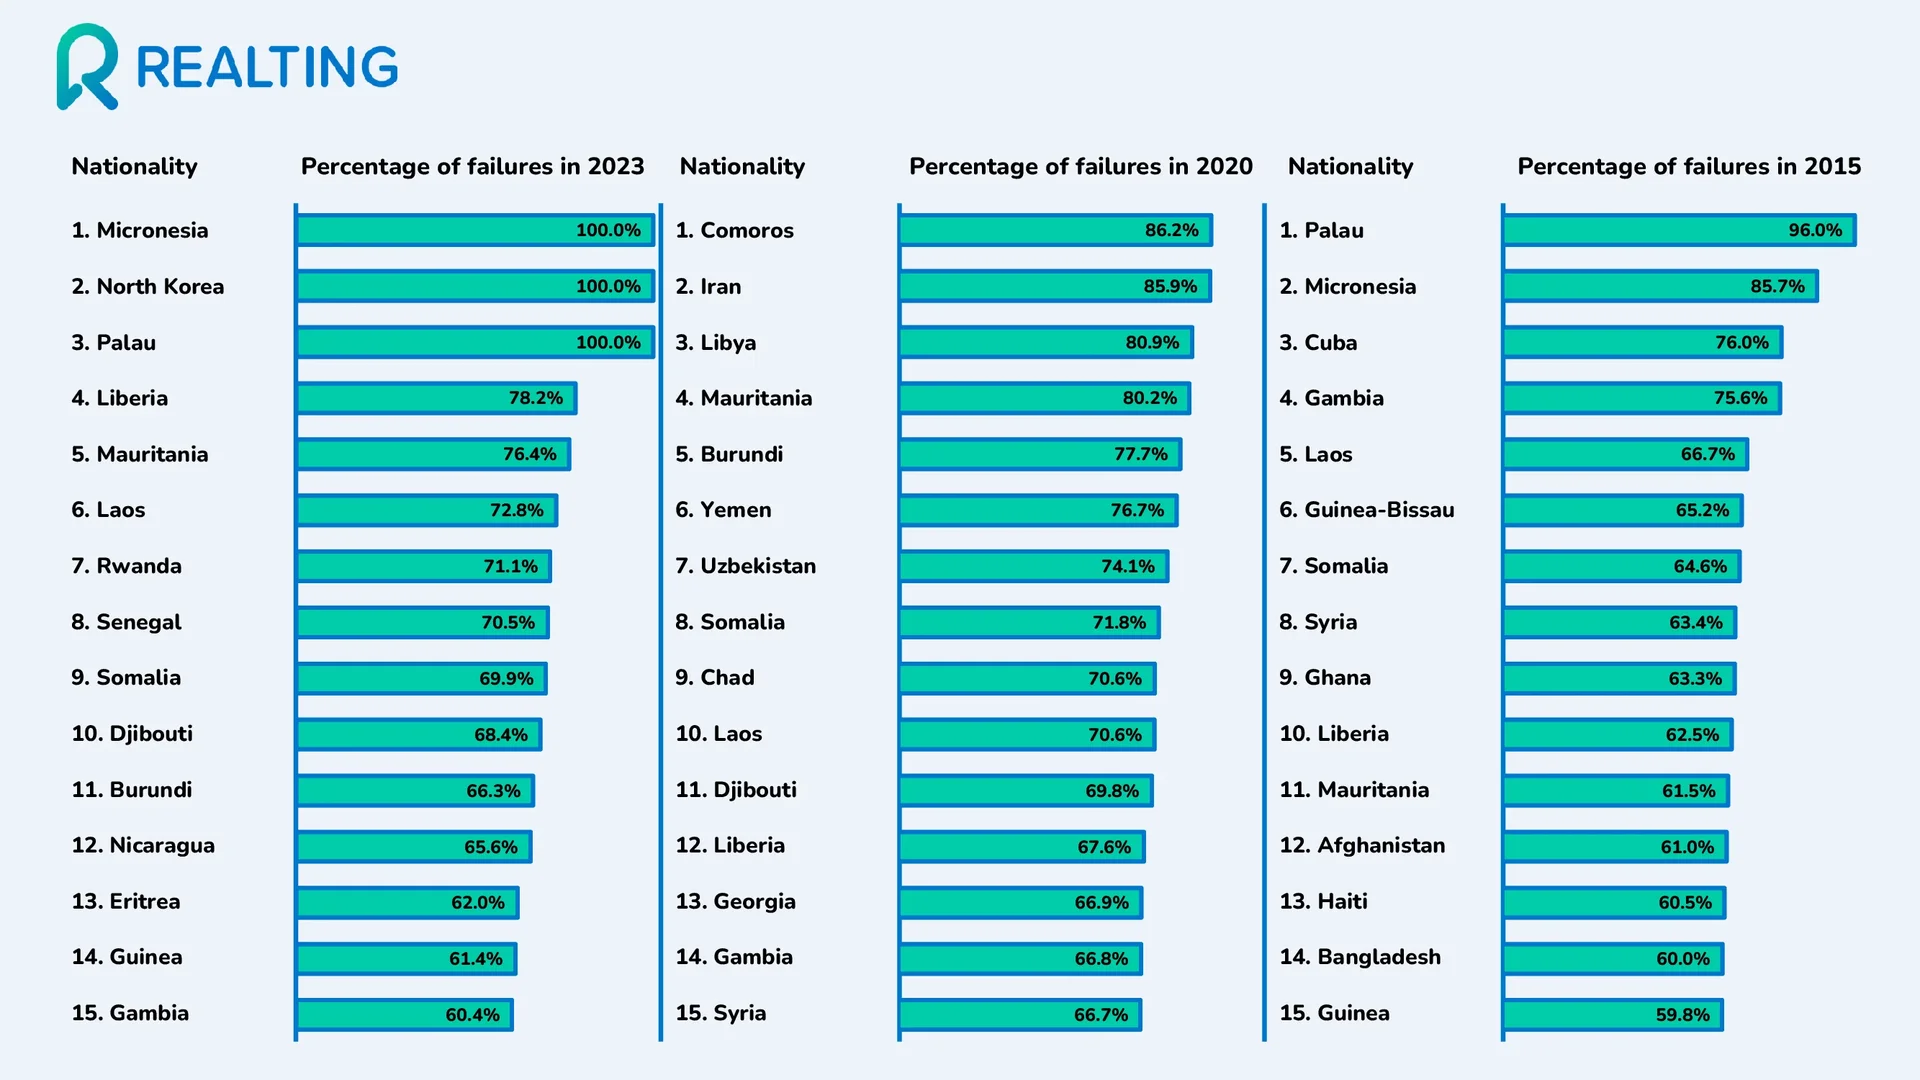
* — It is important to note the following: The US State Department does not report in these statistics exactly how many citizens from a particular country applied for a visa.
Dynamics of Refusals Over the Last 10 Years in Popular Countries
Let’s look at how the percentage of US visitor visa refusals has changed over the course of a year, as well as over five and ten years, using 10 popular countries as an example.
|
Country |
Failure Rate in 2024 |
Failure Rate in 2023 |
Bounce Rate 2020 |
Bounce Rate in 2015 |
|
Türkiye |
19.78% |
20.59% |
17.46% |
|
|
Poland* |
10.99% |
16.47% |
8.91% |
6.37% |
|
Spain* |
16.39% |
15.66% |
20.17% |
17.76% |
|
Portugal* |
7.91% |
10.52% |
9.75% |
8.41% |
|
Switzerland* |
5.39% |
5.36% |
10.92% |
4.62% |
|
Ukraine |
33.45% |
34.29% |
43.14% |
34.03% |
|
Russia |
38.56% |
39.49% |
17.79% |
10.24% |
|
Belarus |
28.79% |
32.80% |
27.01% |
12.53% |
|
UAE |
1.46% |
4.18% |
8.44% |
7.10% |
|
China |
25.37% |
26.63% |
22.12% |
10.03% |
* — It is worth mentioning that Poland, Spain, Portugal, Switzerland are part of the US Visa Waiver Program, which allows citizens or nationals of countries included in this program (there are currently 43 countries in the program) to travel to the US for tourism or business purposes for up to 90 days without obtaining a visa.
However, in order to benefit from visa-free entry, citizens of countries participating in this program must follow certain rules and meet the established requirements, otherwise, they will need to obtain a visa. More information about the visa-free entry program, as well as the requirements for compliance with this program, can be found on the website of the Bureau of Consular Affairs, U.S. Department of State.