Olympic Paris: What is Happening in the Real Estate Market of the French Capital?
What's happening in France's largest market, the Paris housing market? We analyzed price dynamics in all 20 districts of the capital, studied how the Olympics affect supply and demand, and assessed the state of the long-term and short-term rental markets. We also compiled a rating of districts based on safety and noise levels — factors that are critical for life in a metropolis.
The Paris Residential Real Estate Market Before the Start of the Summer Olympics
To begin with, let us remember how the hosting of the Olympic Games influenced the residential real estate market of other cities that happened to host such a large-scale world sports competition. Thus, after the Tokyo Olympics in the summer of 2021, prices per square meter of residential real estate increased by an average of 22%. Since the 2012 London Olympics, residential property prices in the city have risen by 24%. The 2016 Olympic Games in Rio de Janeiro reversed a downward trend in property prices in the city that had persisted for several years.
Thus, hosting the Olympic Games has a positive impact on the real estate market. We should not forget that hosting the Olympics brings with it colossal investments in the infrastructure of the places in which it is held. It will be possible to assess the final impact of the Olympics on the Paris real estate market a few months after its end, but for now, let’s look at the situation in the Paris housing market before the start of the Olympics.
At the end of the 1st half of 2024, 56,962 residential properties were sold in the French capital, which is 0.8% more than in the 2nd half of 2023 and 6.5% less than in the 1st half of 2023. Such data is provided by the portal named immobilier.lefigaro.fr.
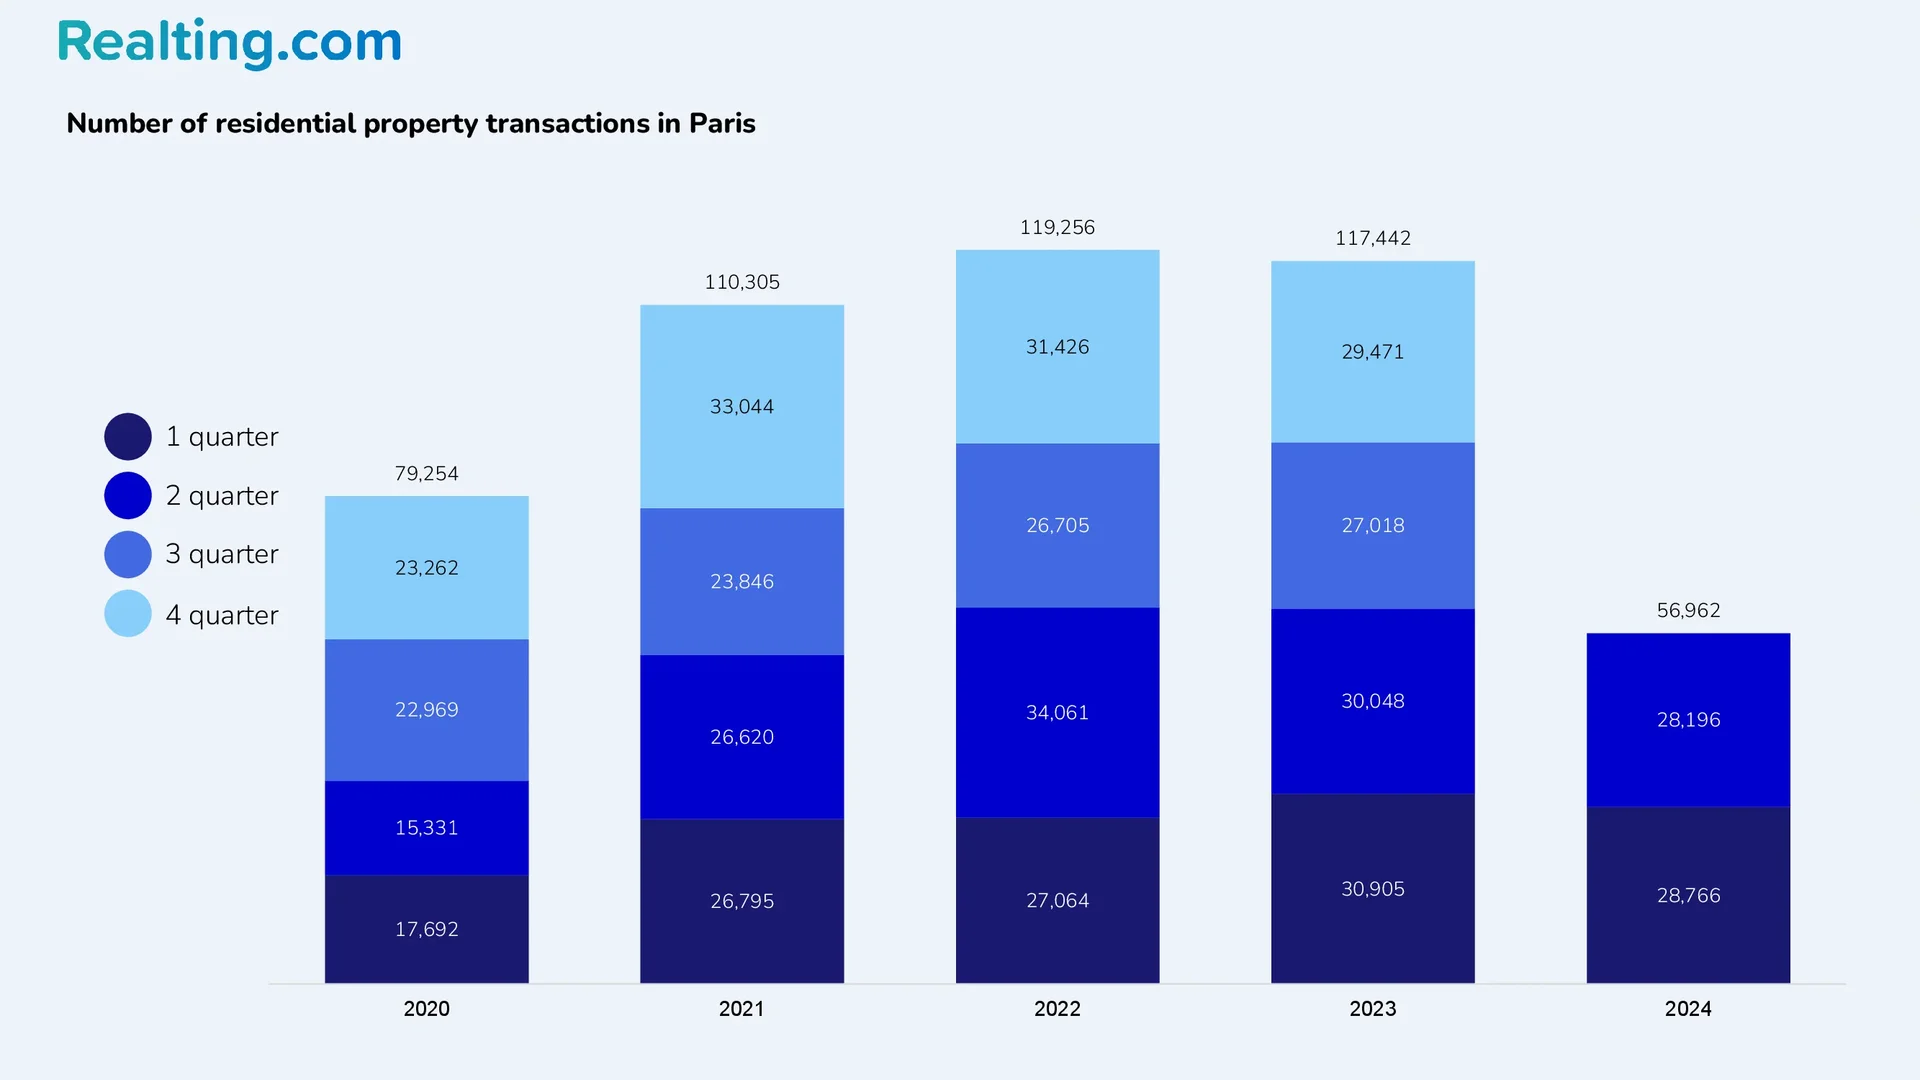
The structure of housing sold is dominated by apartments — their share was about 97% of all residential real estate sold. The remaining 3% was at home.
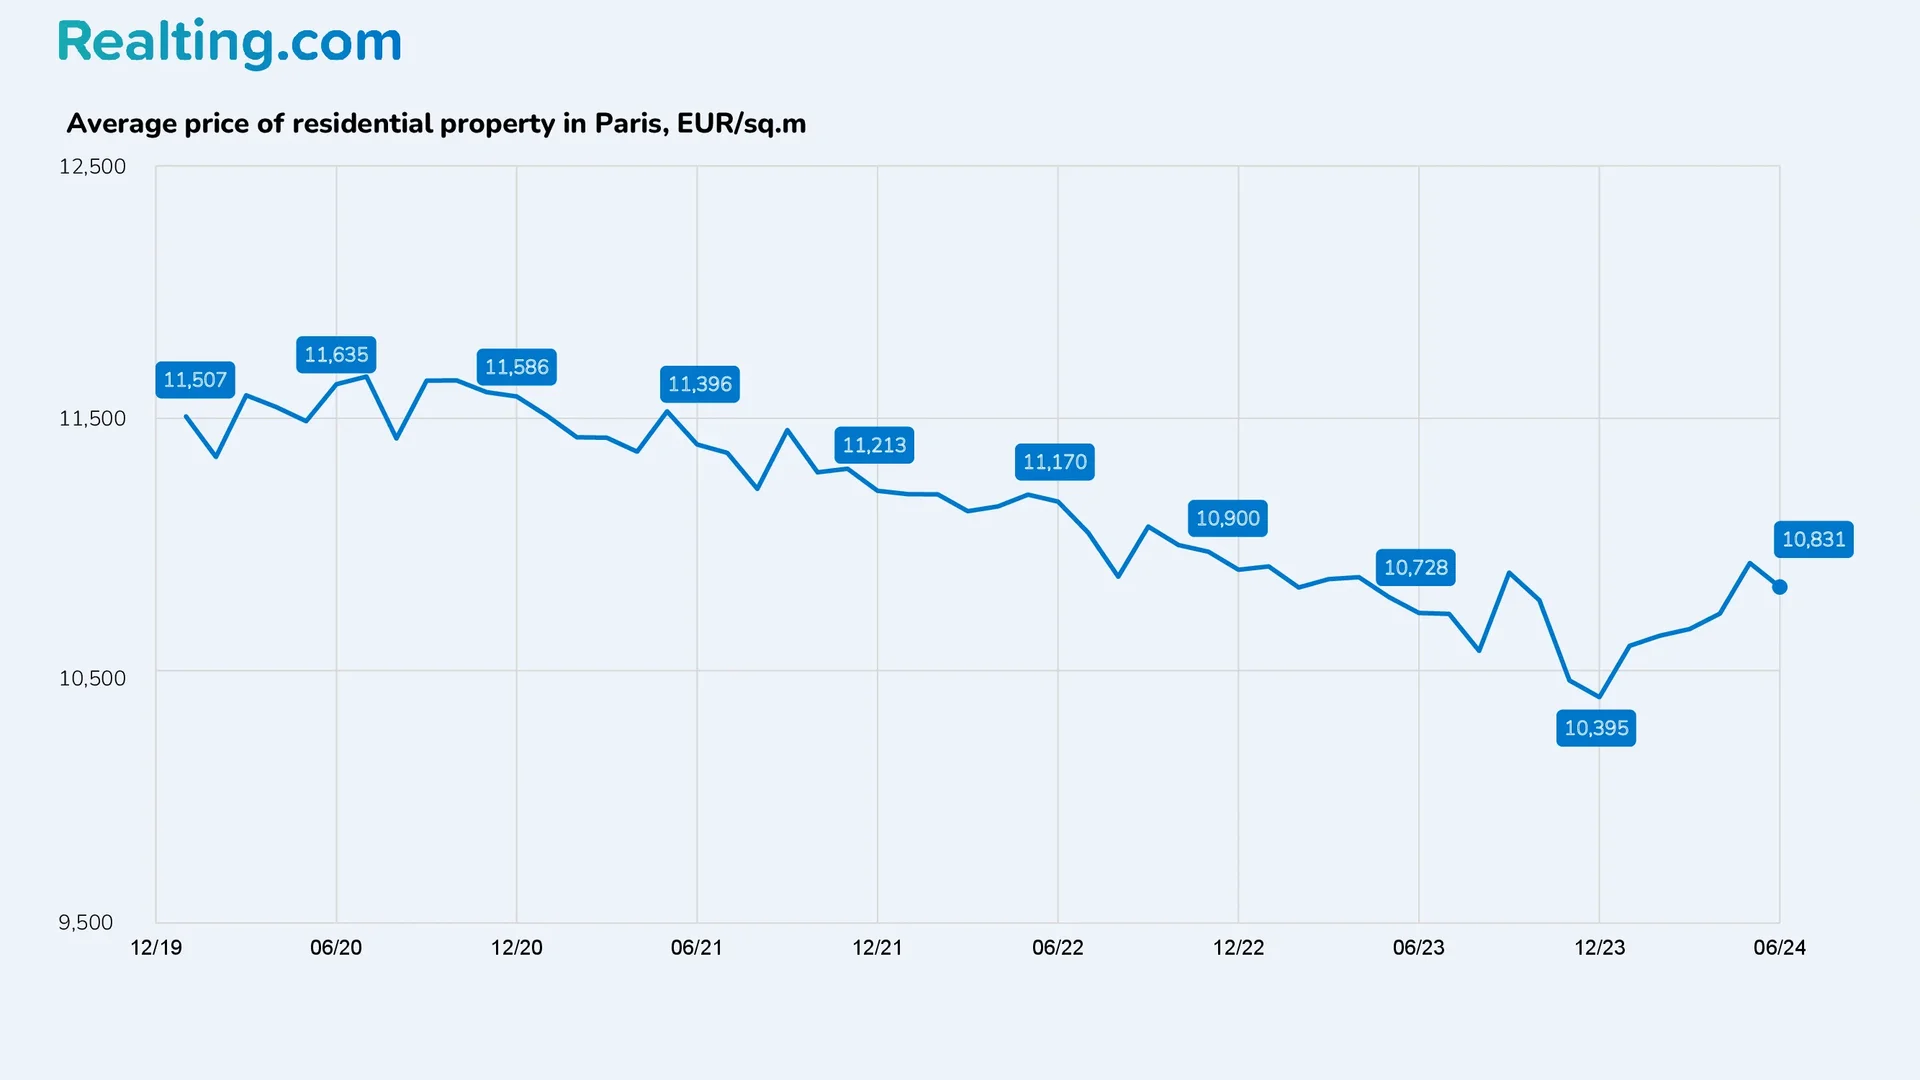
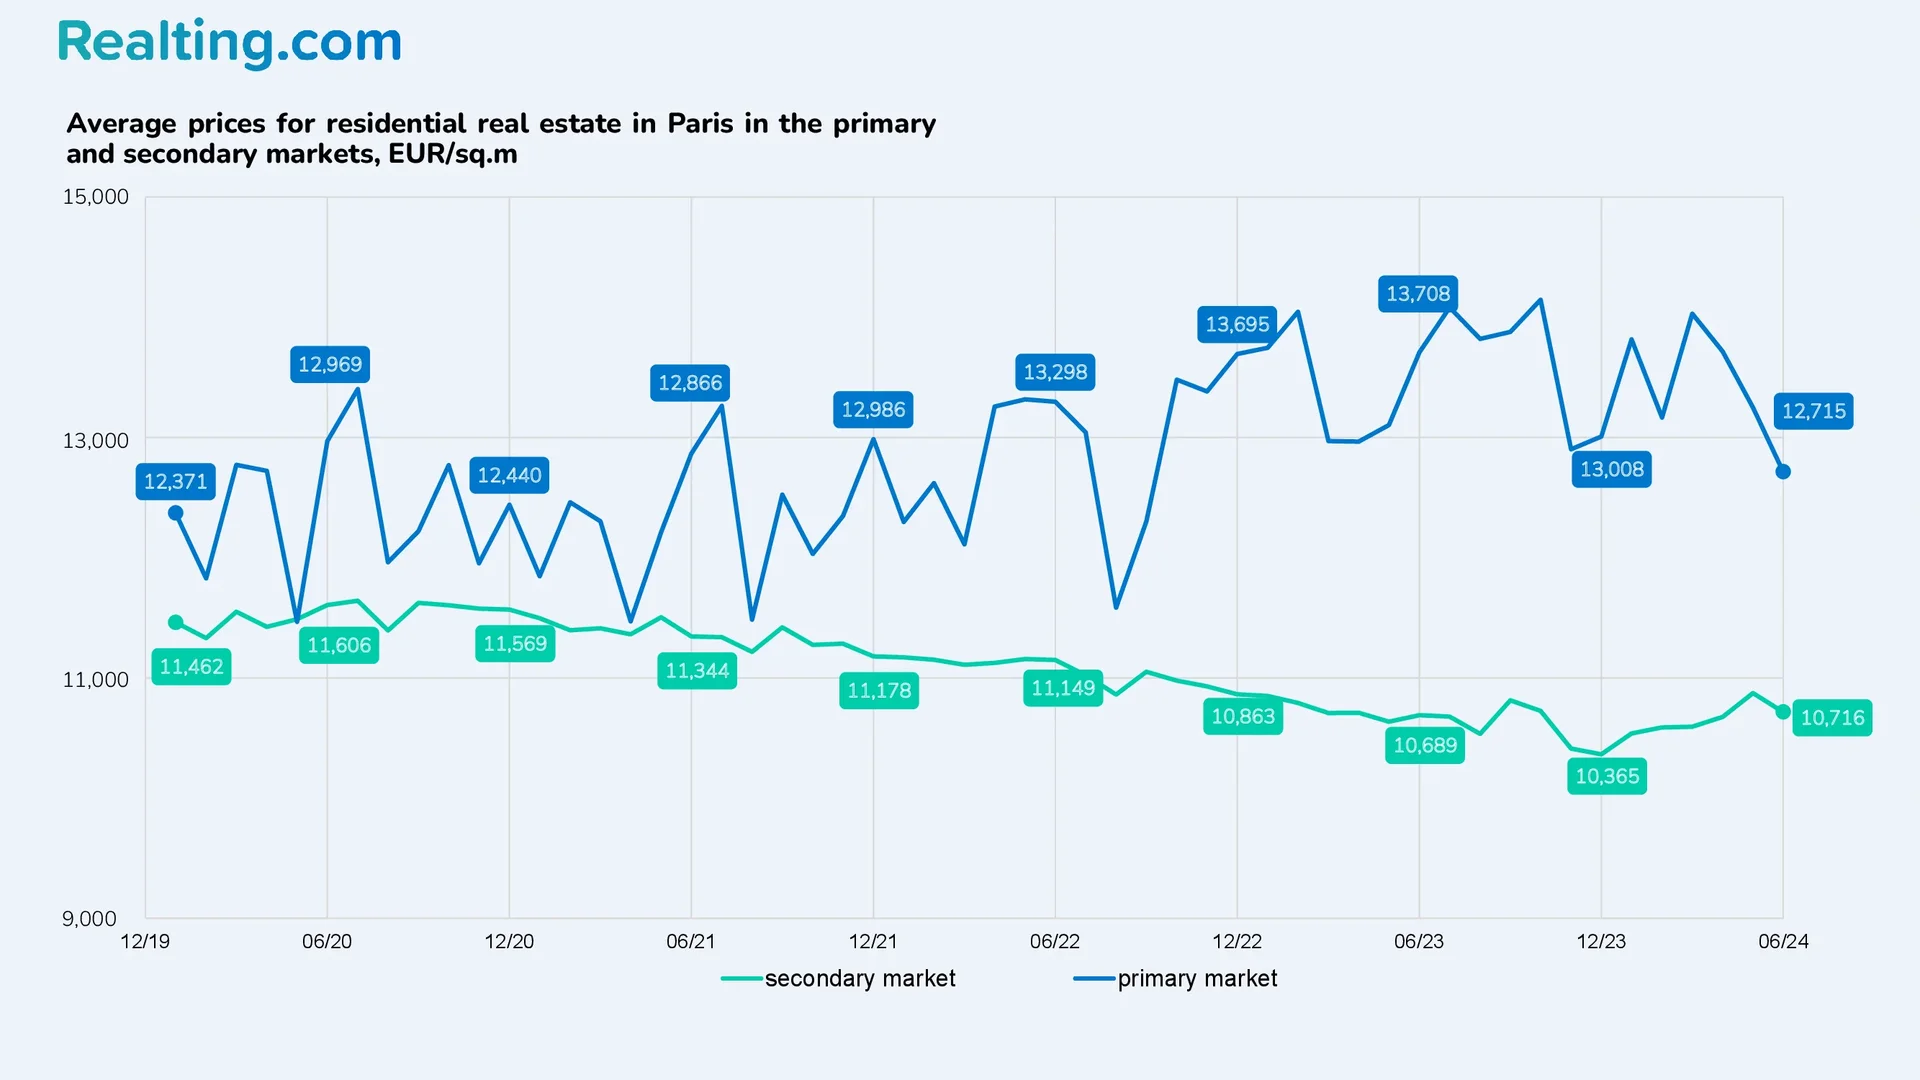
According to immobilier.lefigaro.fr, the average price of residential property in Paris has trended downward since 2020. At the peak of value — in July 2020 — the average price of one square meter of housing in Paris was 11,665 EUR/sq.m, which is 12.2% more than in December 2023, when the price reached its minimum.
Starting from January 2024, Paris has recorded a positive trend in the average cost of housing. At the end of June 2024, the average price for residential real estate in Paris was set at 10,831 EUR/sq.m, which is 0.9% less than in May of this year and 1% more than in June 2023.
In June, the average price for residential real estate on the secondary market in Paris was 10,716 EUR/sq.m, which is 1.5% less than the previous month and 0.3% more than a year ago.
Before talking about the primary market, it is important to say that the primary market in Paris is small. There is no exact data on how many new homes are sold in Paris every month. At the end of the first half of 2024, for 12 of the 20 districts of Paris, there is no data on the sale of new housing.
In June 2024, the average price of one square meter of new housing was 12,715 EUR/sq.m, which is 4% less than in May of this year and 7.2% less than in June last year. Average prices for new housing are subject to more dramatic changes since, due to the smaller volume of the market, individual new residential complexes can have a significant impact on the price.
Residential Property Prices by Paris Districts
The capital of France is divided into 20 municipal districts, which differ in the number of residents, area, infrastructure, and, of course, the cost of housing. If we look at the districts of Paris on the map, it is striking that 20 districts form a spiral, where districts 1-4 are the center of Paris, districts 5-12 completely surround the central districts along the perimeter, and districts 13-20, in turn, surround the previously mentioned 5 -12th district.
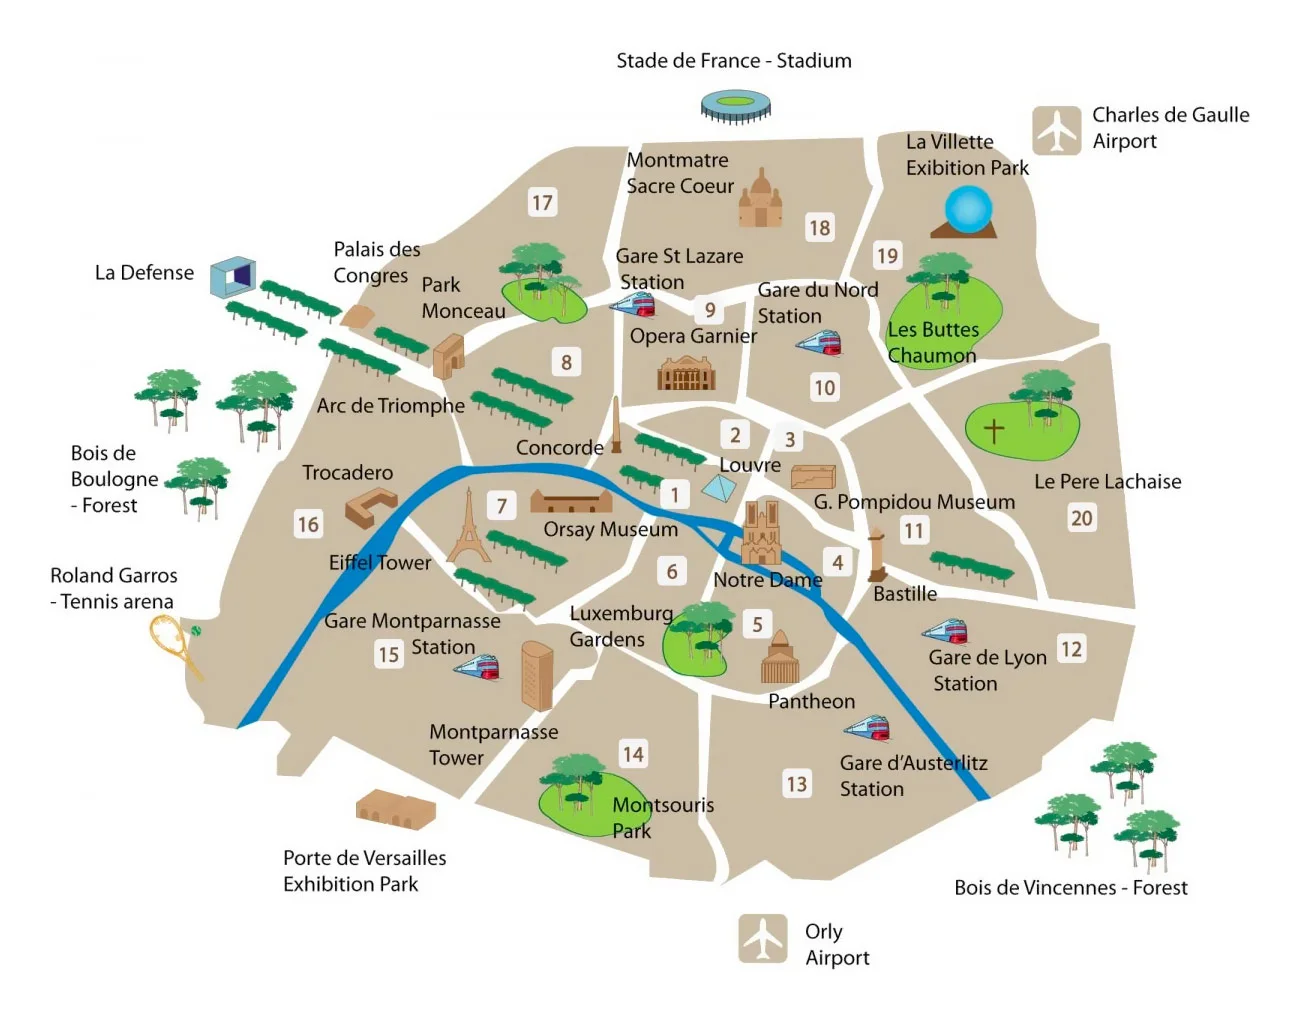
Image taken from eurolines.fr
Below is a table with data on the area and population of each of the 20 districts of Paris.
|
District (county name) |
Population as of January 1, 2024* |
Area, ha |
Density (persons/km2) |
|
1st district (Louvre) |
15,919 |
183 |
8699 |
|
2nd district (Exchange) |
21.119 |
99 |
21,332 |
|
3rd district (Temple) |
32,793 |
117 |
28,028 |
|
4th district (Hotel de Ville) |
28,324 |
160 |
17,703 |
|
5th district (Pantheon) |
56,841 |
254 |
22,378 |
|
6th district (Luxembourg) |
40,209 |
215 |
18,702 |
|
7th district (Palais-Bourbon) |
47,947 |
409 |
11,723 |
|
8th district (Champs Elysees) |
35.123 |
388 |
9052 |
|
9th district (Opera) |
58,951 |
218 |
27,042 |
|
10th district (Enclos-Saint-Laurent) |
83,543 |
289 |
28,908 |
|
11th district (Paupancourt) |
142,583 |
367 |
38,851 |
|
12th district (Röyi) |
140,954 |
637 |
22.128 |
|
13th district (Tapestry) |
178,350 |
715 |
24,944 |
|
14th district (Observatory) |
136,368 |
564 |
24,179 |
|
15th district (Vaugirard) |
227,746 |
848 |
26,857 |
|
16th district (Passy) |
162,061 |
791 |
20,488 |
|
17th district (Batignolles-Monceau) |
164,413 |
567 |
28,997 |
|
18th district (Montmartre) |
188,446 |
601 |
31,355 |
|
19th district (Buttes-Chaumont) |
181,616 |
679 |
26,748 |
|
20th district (Mesnilmontant) |
189,805 |
598 |
31,740 |
* – according to data from the French National Institute of Statistics and Economic Research
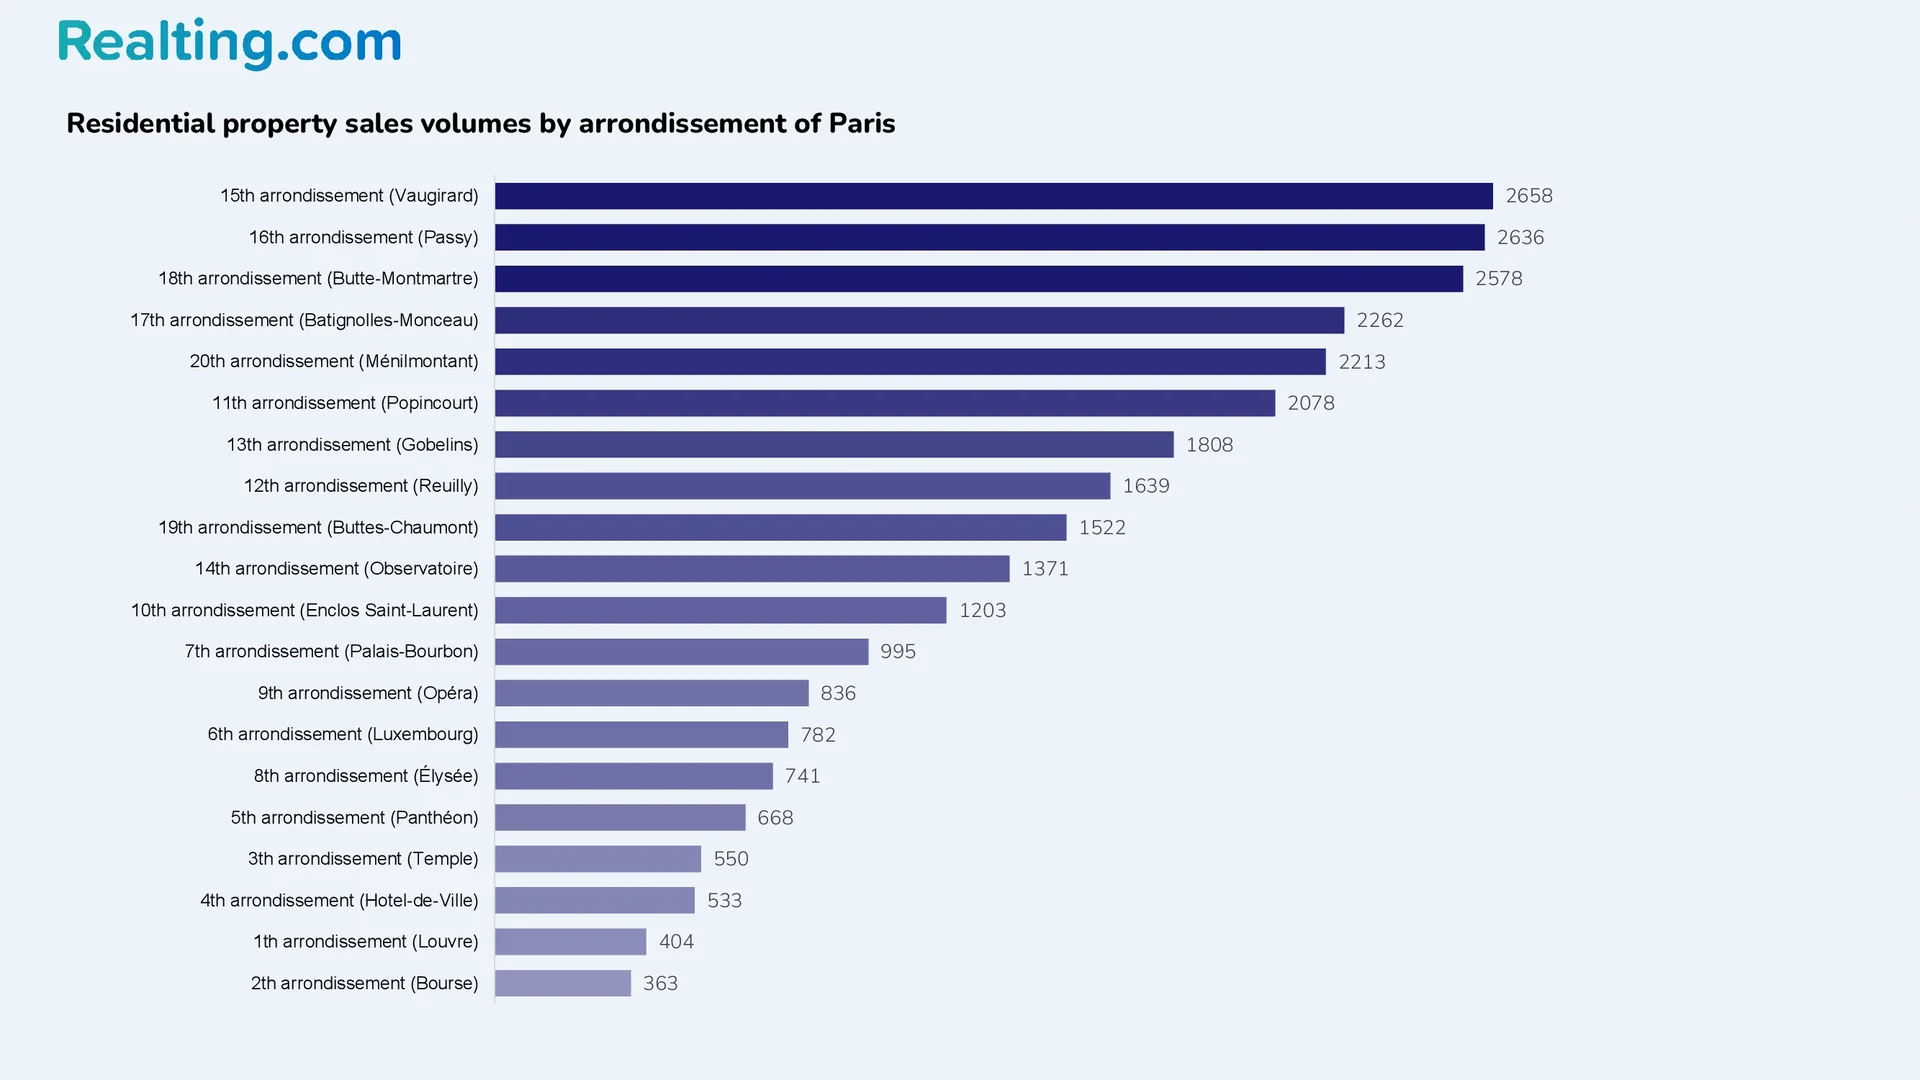
In the 2nd quarter of 2024, the most popular districts for purchasing residential real estate were the 15th (Vaugiard), 16th (Passy), 18th (Montmartre) districts — these are some of the largest districts in Paris.
The most expensive counties for purchasing a home are the 6th (Luxembourg), 7th (Palais-Bourbon), and 4th (Temple) districts.
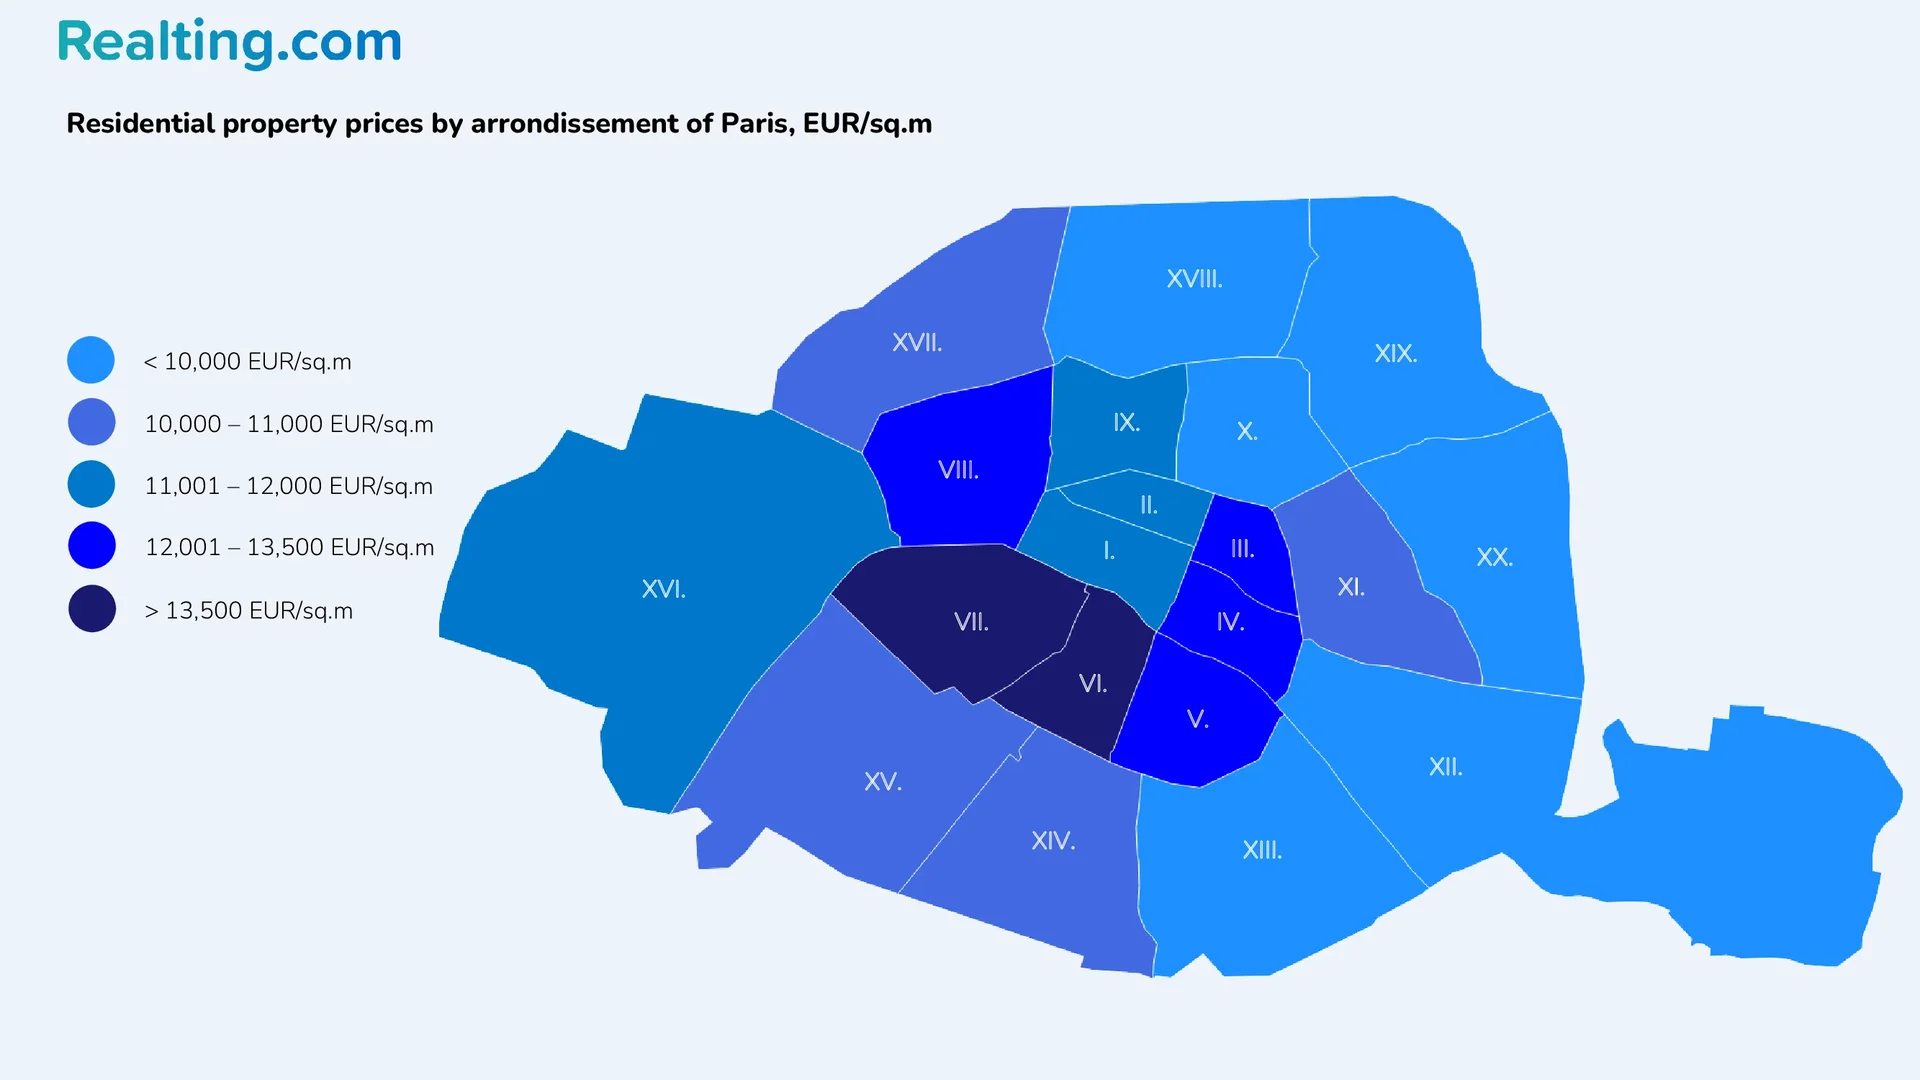
6th district (Luxembourg) — the central district of the capital, which takes its name from the Luxembourg Palace, built in 1631. Other attractions in the area include the Abbey of Saint-Germain-des-Prés and the Luxembourg Gardens. In this district, housing available for purchase is represented mainly by apartments on the secondary market. The average price of an apartment on the secondary market in the 6th district at the end of June of this year was 15,236 EUR/sq.m.
7th district(Palais-Bourbon) – the district where the most famous landmark not only of Paris, but of all of France is located — the Eiffel Tower; the district itself received its name in honor of the Bourbon Palace — the place where the French National Assembly meets. The residential real estate market in the 7th district is represented by apartments on the secondary market; the average price of one square meter at the end of June 2024 was 14,998 EUR/sq.m.
4th district(Hotel de Ville) is considered the historical center of Paris. It is named after the Hôtel de Ville Town Hall, which has housed the Parisian municipal authorities since the 14th century. Other attractions in the 4th district include Notre-Dame de Paris Cathedral and the National Center for Art and Culture Georges Pompidou. The housing market in the 4th district is also represented by apartments on the secondary market; the average price of one square meter in this district is 13,498 EUR/sq.m.
Below is a summary table with information for the districts of Paris on the average price of one square meter of apartment on the secondary market based on the results of June 2024.
Average price of one square meter on the secondary market in Paris, EUR/sq.m.
|
District (county name) |
Average price, EUR/sq.m |
Change by June 2023 |
Average price per square meter by number of rooms, EUR/sq.m |
||
|
Studios/1-room apartments |
2-room apartments |
3-room apartments |
|||
|
1st district(Louvre) |
12,781 |
-3.2% |
12,441 |
12,520 |
12.825 |
|
2nd district (Exchange) |
11,912 |
-3.7% |
11,549 |
12,029 |
12,233 |
|
3rd district (Temple) |
12,450 |
-2.7% |
12,391 |
12,245 |
12,384 |
|
4th district(Hotel de Ville) |
13,498 |
-1.8% |
13,138 |
13,342 |
13,250 |
|
5th district(Pantheon) |
12,757 |
-1.7% |
12,613 |
12,549 |
12,584 |
|
6th district(Luxembourg) |
15,236 |
-2.6% |
14,243 |
14,370 |
15,252 |
|
7th district(Palais-Bourbon) |
14,998 |
-2.9% |
13,926 |
14.109 |
15,253 |
|
8th district(Champs Elysees) |
12,751 |
-3.7% |
11,586 |
12,713 |
12,786 |
|
9th district(Opera) |
11,208 |
-4.3% |
10,796 |
11,069 |
11,315 |
|
10th district(Enclos-Saint-Laurent) |
9802 |
-4.9% |
9845 |
9759 |
9850 |
|
11th district(Paupancourt) |
10,509 |
-3.4% |
10,562 |
10,435 |
10,404 |
|
12th district (Röyi) |
9799 |
-4.4% |
9775 |
9511 |
9753 |
|
13th district(Tapestry) |
9653 |
-0.8% |
9772 |
9478 |
9596 |
|
14th district(Observatory) |
10,090 |
-5.3% |
10,255 |
9849 |
9932 |
|
15th district(Vaugirard) |
10,401 |
-3.4% |
10,612 |
10.102 |
10,012 |
|
16th district(Passy) |
11,631 |
-4.1% |
11,317 |
11,094 |
11,138 |
|
17th district(Batignolles-Monceau) |
10,812 |
-5.1% |
10,498 |
10,429 |
10,720 |
|
18th district(Montmartre) |
9478 |
-4.1% |
9363 |
9435 |
9326 |
|
19th district(Buttes-Chaumont) |
8608 |
-5.3% |
8803 |
8623 |
8354 |
|
20th district(Mesnilmontant) |
9251 |
-4.4% |
9602 |
9123 |
8942 |
If you are aiming to buy an apartment on the primary market, then you must understand that it will almost always be an apartment in the districts that are located on the outskirts of Paris - these are districts from 11 to 20. In combination, these will be the districts with the largest area and the largest population population.
Average price of one square meter in the primary market of Paris, EUR/sq.m
|
District (county name) |
Average price per square meter by number of rooms, EUR/sq.m |
||
|
Studios/1-room apartments |
2-room apartments |
3-room apartments |
|
|
11th district |
14,468 |
13,948 |
13,280 |
|
12th district |
13,306 |
12,252 |
12,668 |
|
13th district |
12,872 |
11,990 |
11,724 |
|
15th district |
15.110 |
14,391 |
13,241 |
|
18th district |
10,179 |
11,583 |
13,382 |
|
19th district |
12,594 |
11,647 |
11.119 |
|
20th district |
12,437 |
11,759 |
12,334 |
If you are focused on buying a house in the capital of France, then it is best to turn your attention to the 20th (Mesnilmontant), 19th (Buttes-Chaumont), 16th (Passy), and 13th (Tapestry) districts of Paris . These are the counties where most homes were sold in the 2nd quarter of 2024. The most expensive district among them was the 16th (Passy) — here, the average cost of one square meter when buying a house was 15,093 EUR/sq.m. In the remaining districts, the price per square meter to buy a house was as follows: in the 20th district, 11,651 EUR/sq.m, in the 19th, 9095 EUR/sq.m, in the 13th, 9554 EUR/sq.m.
Safety Rating of Paris Arrondissements
It would not be amiss to analyze the districts of Paris from a security point of view.
At the end of 2023, the French Ministry of the Interior published data on the security situation in the French capital. As a result, Paris districts were ranked from safest to least safe. The criteria were: assault, theft, burglary, drug trafficking, and intentional harm.
The safest districts were the 20th (Mesnilmontant), 14th (Observatory), 15th (Vaugiard), 17th (Batignolles-Monceau) districts — these are the districts of Paris with the least number of tourists.
The central districts of Paris are the least safe districts of the French capital. The district with the least security level in 2023 was the 2nd (Bourse) arrondissement, followed closely by the 8th (Champs-Elysees), 4th (Hotel de Ville), and 3rd (Temple) arrondissement. These are also the districts most often visited by tourists.
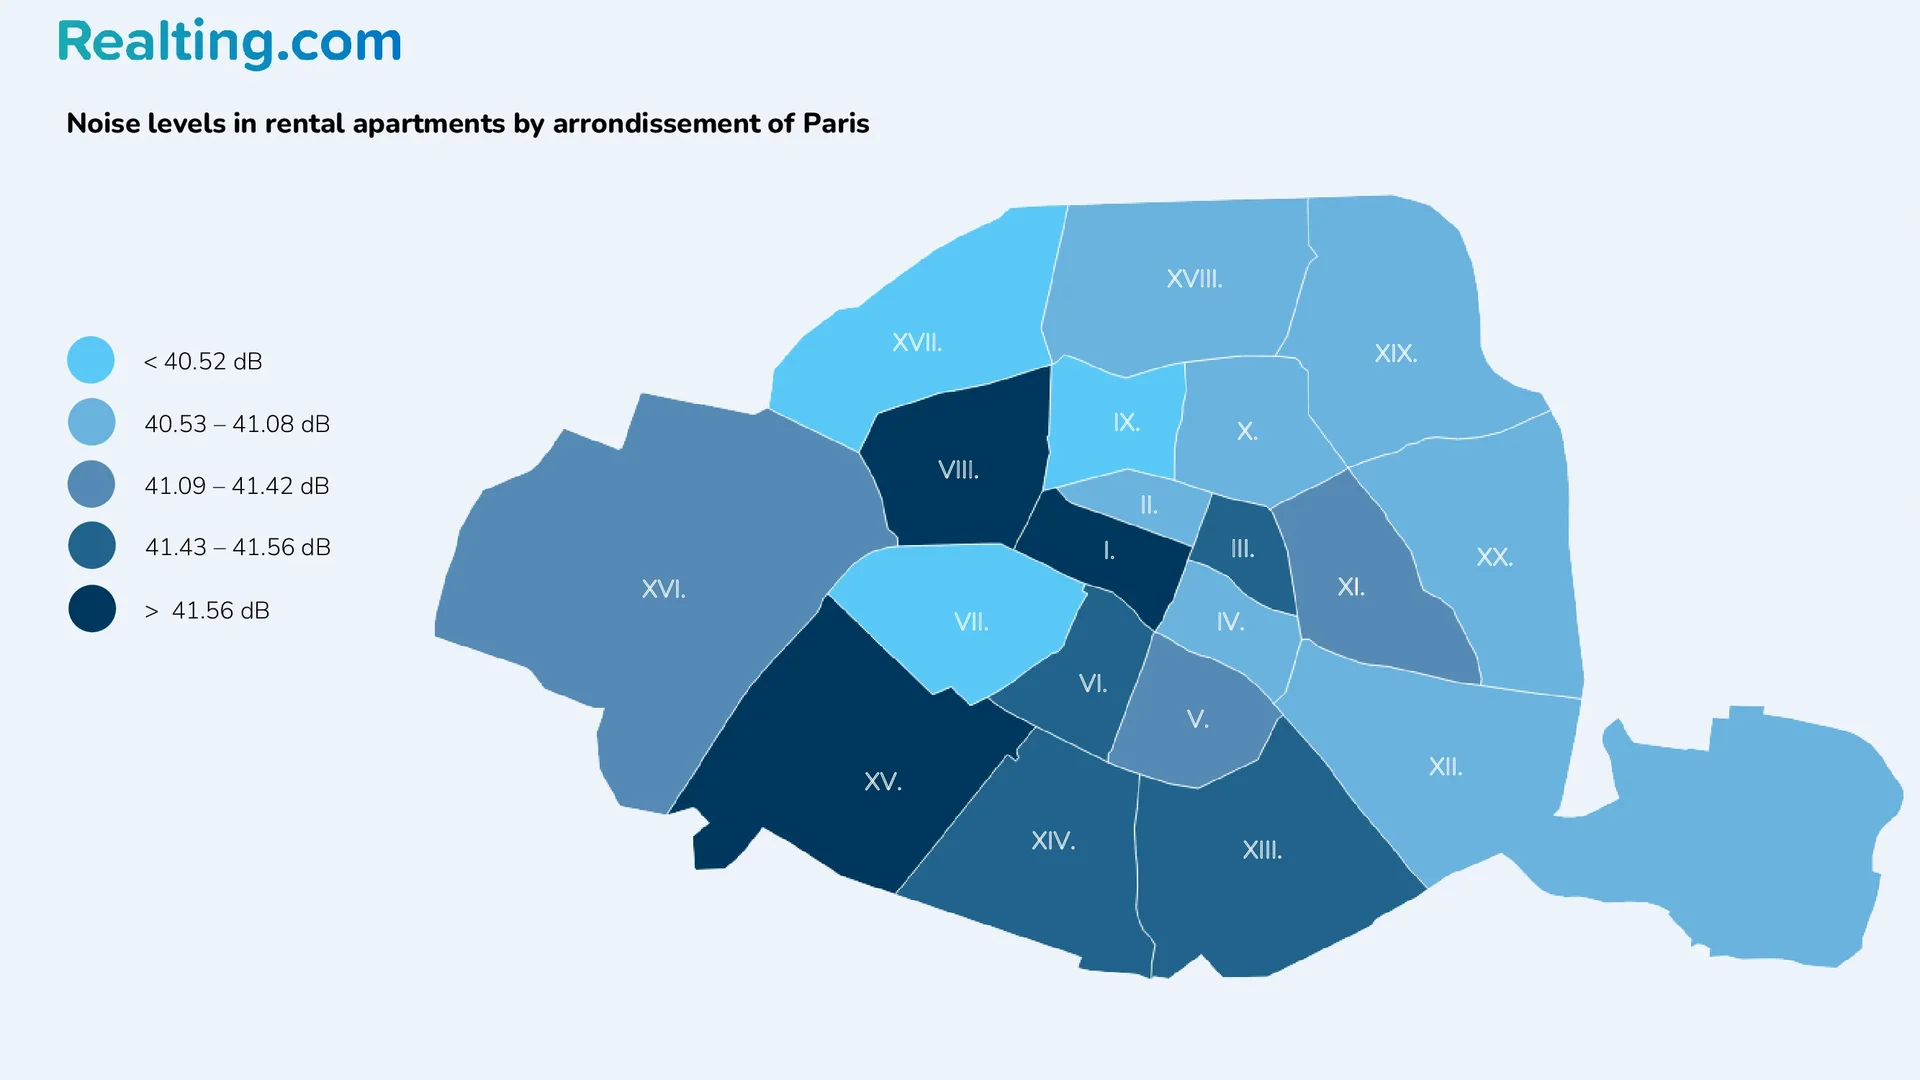
Rating of Paris Districts by Noise Level
The portal bfmtv.com published a study in which the sound intensity of 2,500 rental apartments was measured. Below is a map with the results.
Long-Term Rental Market
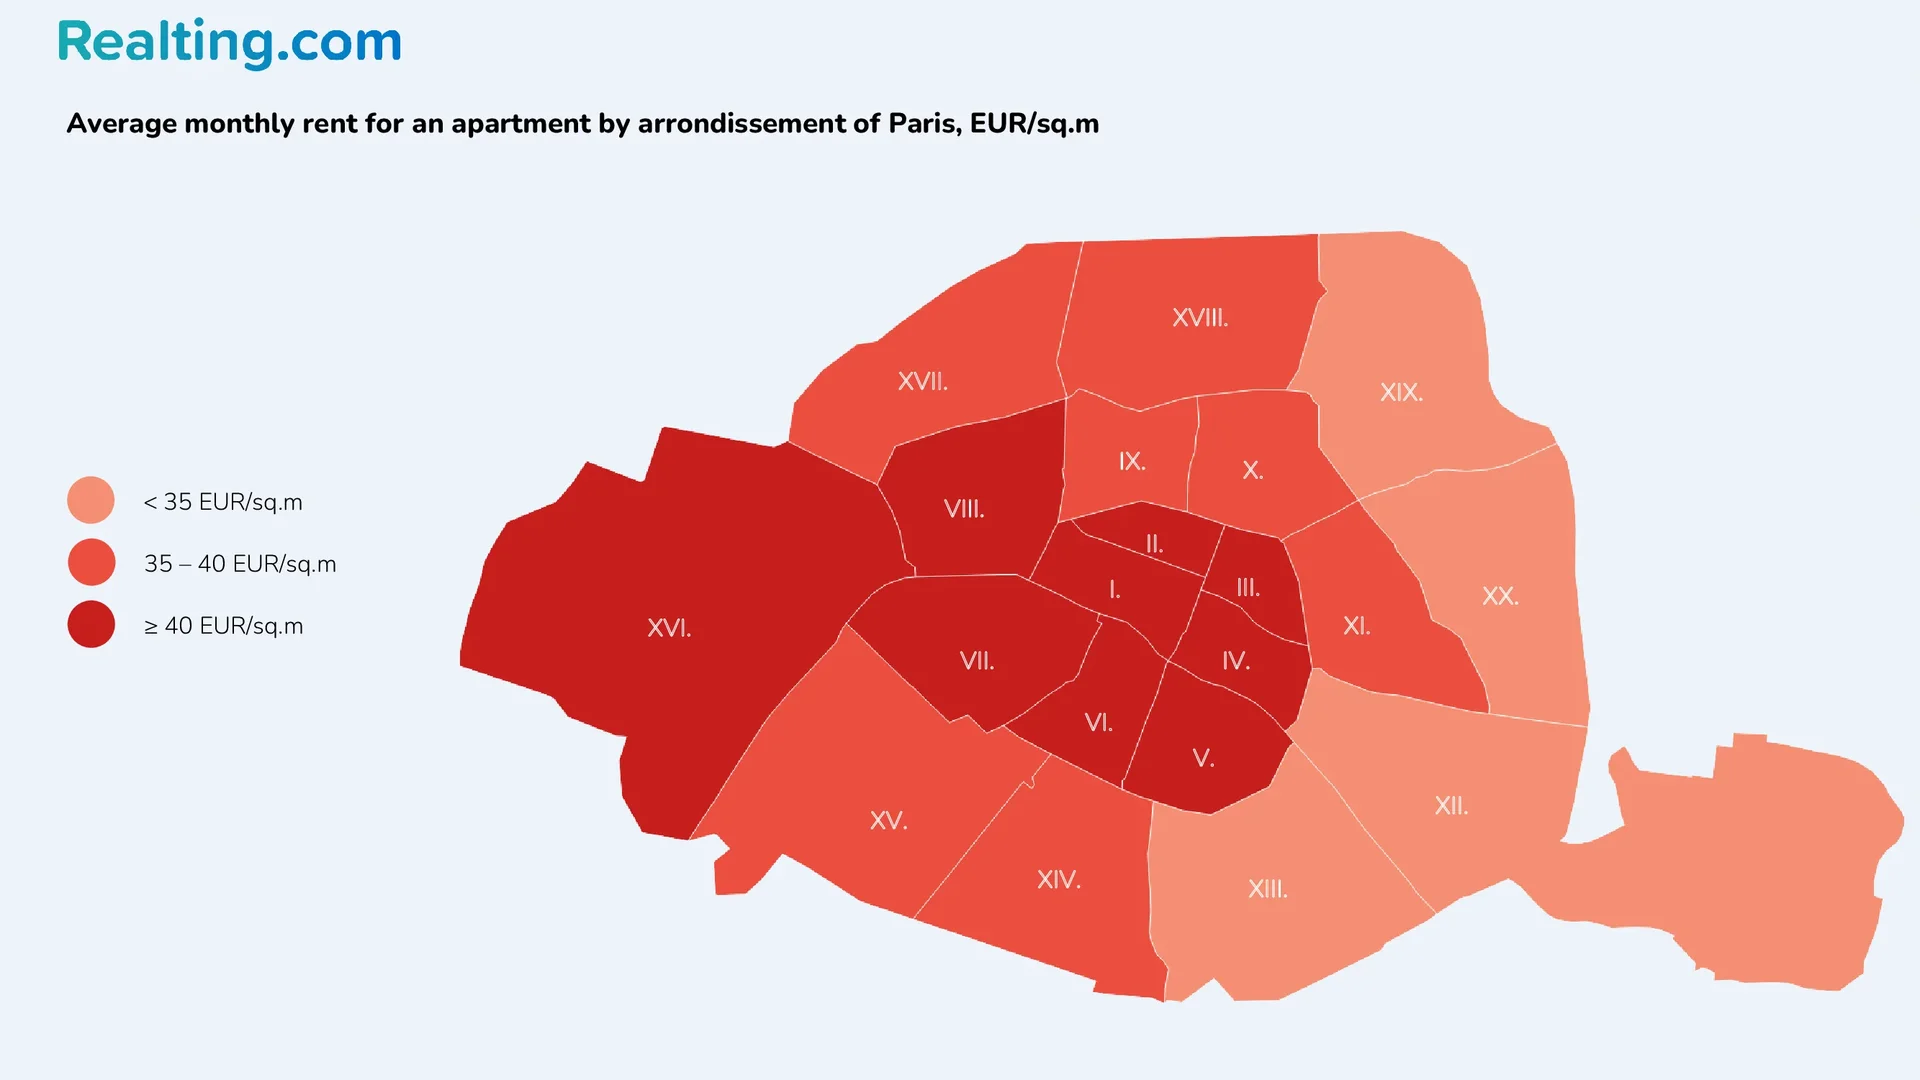
According to the portal immobilier.lefigaro.fr, the median rent in Paris in June 2024 was 39 EUR/sq.m for long-term rental apartments. Over the year, rent increased by 8.3% (in June 2023, the median rent in the city was 36 EUR/sq.m).
Below is a map and table showing the rent for long-term rental apartments by county (as of June 2024).
Amount of rent for long-term rental of an apartment, EUR/sq.m.
|
District (county name) |
From, EUR/sq.m |
Median, EUR/sq.m |
Up to, EUR/sq.m |
Average rent by number of rooms, EUR/sq.m |
||
|
Studios/1-room apartments |
2-room apartments |
3-room apartments |
||||
|
1st district(Louvre) |
18 |
40 |
62 |
43 |
39 |
37 |
|
2nd district (Exchange) |
29 |
42 |
64 |
46 |
40 |
37 |
|
3rd district (Temple) |
thirty |
42 |
63 |
46 |
40 |
36 |
|
4th district(Hotel de Ville) |
29 |
43 |
65 |
46 |
42 |
39 |
|
5th district(Pantheon) |
29 |
41 |
57 |
44 |
38 |
36 |
|
6th district(Luxembourg) |
29 |
44 |
67 |
48 |
43 |
40 |
|
7th district(Palais-Bourbon) |
thirty |
43 |
64 |
48 |
41 |
40 |
|
8th district(Champs Elysees) |
26 |
42 |
70 |
48 |
40 |
38 |
|
9th district(Opera) |
26 |
39 |
61 |
45 |
37 |
35 |
|
10th district(Enclos-Saint-Laurent) |
26 |
37 |
54 |
42 |
35 |
33 |
|
11th district(Paupancourt) |
28 |
38 |
55 |
42 |
36 |
33 |
|
12th district (Röyi) |
26 |
34 |
50 |
40 |
32 |
thirty |
|
13th district(Tapestry) |
26 |
34 |
48 |
39 |
33 |
thirty |
|
14th district(Observatory) |
27 |
35 |
49 |
41 |
33 |
31 |
|
15th district(Vaugirard) |
27 |
35 |
53 |
41 |
34 |
31 |
|
16th district(Passy) |
29 |
40 |
63 |
47 |
38 |
36 |
|
17th district(Batignolles-Monceau) |
29 |
38 |
58 |
44 |
36 |
34 |
|
18th district(Montmartre) |
27 |
36 |
52 |
40 |
34 |
thirty |
|
19th district(Buttes-Chaumont) |
22 |
32 |
49 |
37 |
31 |
28 |
|
20th district(Mesnilmontant) |
24 |
34 |
48 |
38 |
32 |
28 |
Short-term Rental Market
All past Olympic Games brought with them a surge in the short-term rental market — the same effect was expected from the Olympics in Paris. Many Parisians were planning to rent out their apartments in the hope of making money, as there were expectations that the cost of short-term rentals would increase by 2–3 times. Now, a week after the start of the Olympic Games, we can say that the hopes of many Parisian landlords have not been justified.
Portal hello.pricelabs.co, in its article “Paris Olympics 2024: Impact on the Vacation Rental Market,” writes the following: data received as of July 25 shows a decrease in occupancy of short-term rental housing during the Olympics. The occupancy rate at this time is 42.9%, which is 12% less than in the first 2 weeks of July 2024 (then the occupancy rate was 55.1%). They also note that occupancy during the Olympic Games is 9% lower than for the same period in 2023.
The decline in short-term rental occupancy can be attributed to the significant increase in rental listings, which increased from 74,386 listings in the same period in 2023 to 140,539 listings during the games.
In turn, the number of nights booked in Paris increased by 56% compared to the same period in 2023: from 594,195 to 926,855 for dates from July 28 to August 13, 2024. This growth highlights the increased demand for short-term rentals during the Olympics.
According to hello.pricelabs.co, the average daily rate (ADR) for short-term rentals in Paris has increased during the Olympics. During the games, ADR reached 342.15 EUR/day, which is 44% more than in the first 2 weeks of July (238.03 EUR/day). This definitely disappointed Parisian landlords, as they were mostly expecting an increase of 2–3 times.
Conclusion
The first six months of 2024 look promising for the Paris residential property market. The European Central Bank is expected to continue cutting key rates in the subsequent months of 2024. As expected, this should lead to a reduction in lending rates in the real estate market, which, in turn, will increase demand from potential buyers and stimulate activity in the market.
Paris still remains an attractive place for real estate investment, but it is worth understanding that such investments are long-term investments. Currently, the Paris housing market is recording positive dynamics in price changes, but they are still far from reaching the level that was observed 2–3 years ago.


