Hungary Real Estate 2025: Transactions, Prices, Mortgages — First Half-Year Data
The Hungarian real estate market in 2024–2025 is showing contradictory trends, and it’s worth understanding the causes and consequences. This article presents detailed statistics on transactions, prices, mortgage lending, and regional specifics of the Hungarian housing market based on official sources.
Dynamics of Housing Sale Transactions
In 2024, Hungary registered 131,076 residential property transactions by private individuals, according to the Hungarian Central Statistical Office (KSH). This is 24.61% higher than in 2023 (105,192 transactions — the lowest number since 2014).
The record year in the last decade was 2018, with 163,595 transactions.
For 2025, preliminary KSH data show 58,088 housing transactions in the first half of the year — 14.22% less than in H1 2024 but 12.81% more than in H1 2023.
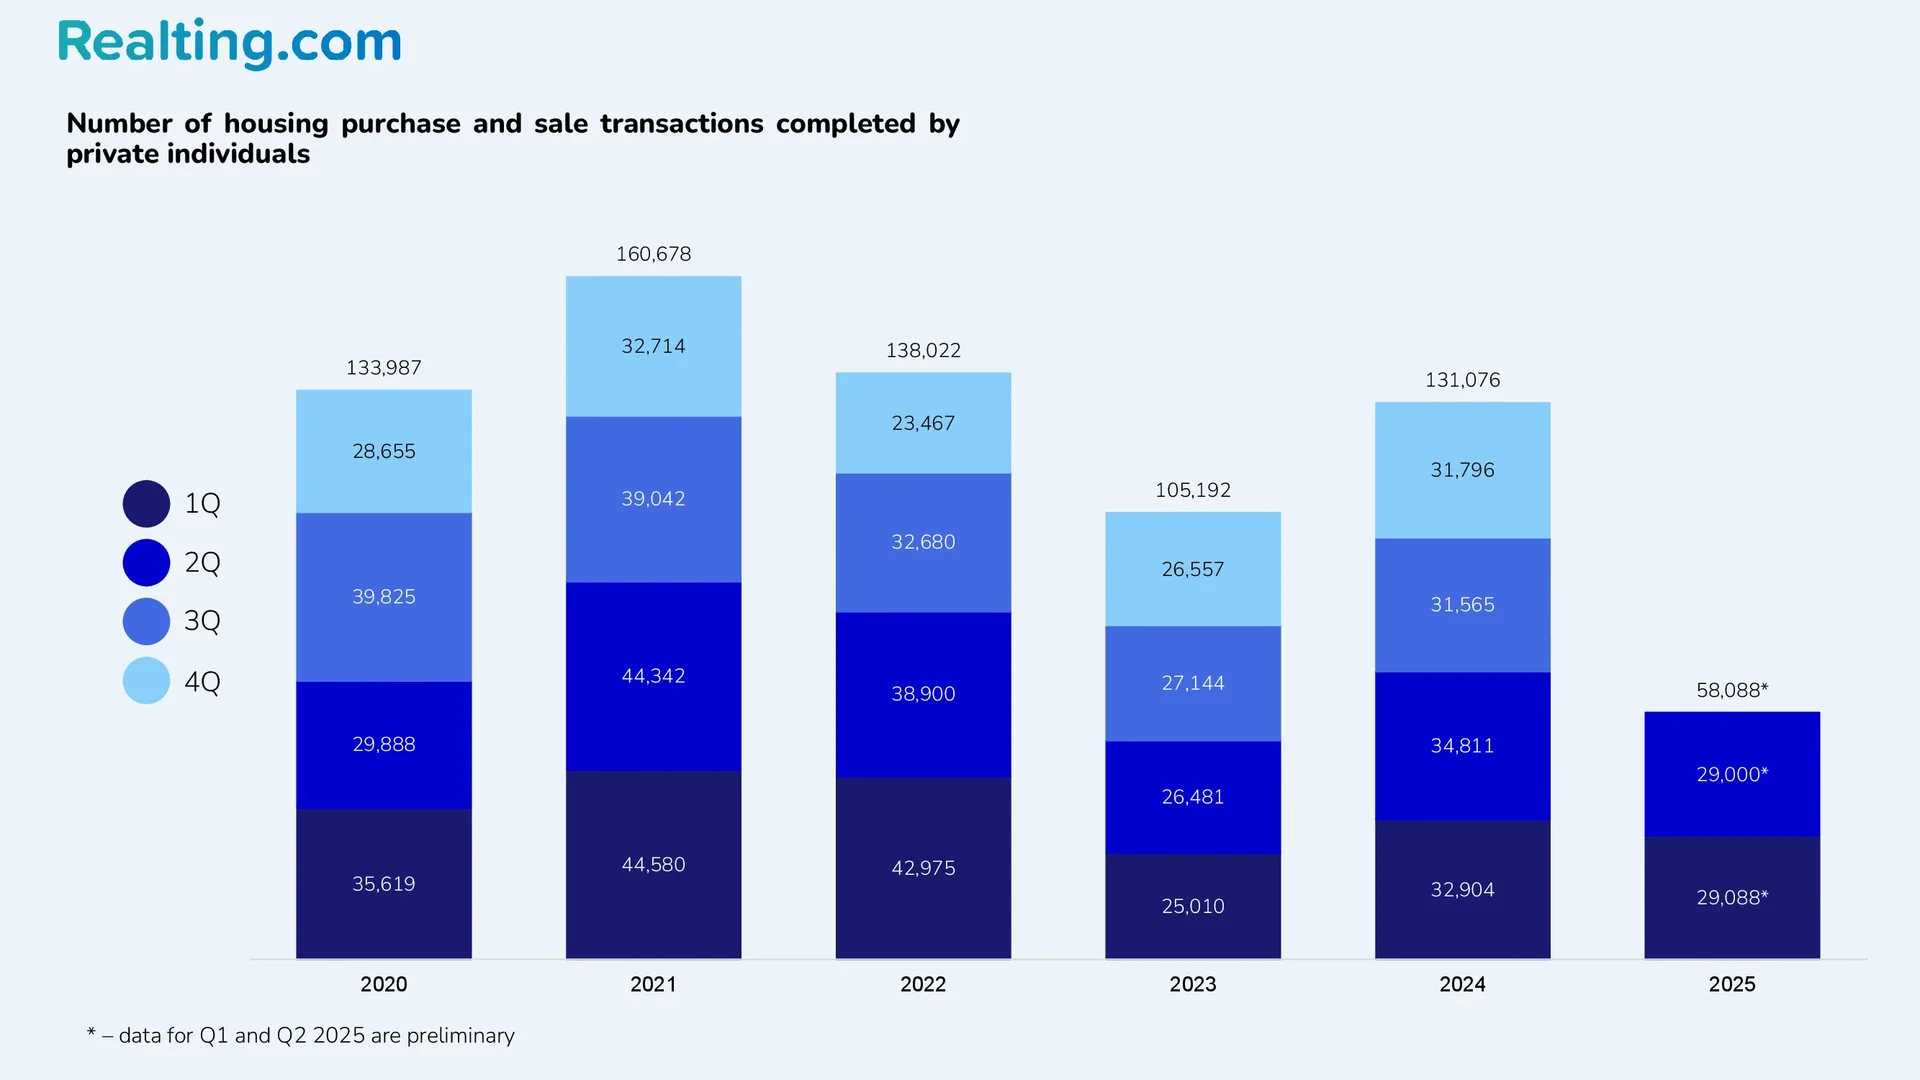
Note: data for Q1 and Q2 2025 are preliminary and may increase significantly over time. As of November 2025, Q1 stands at 29,088 transactions and Q2 at approximately 29,000.
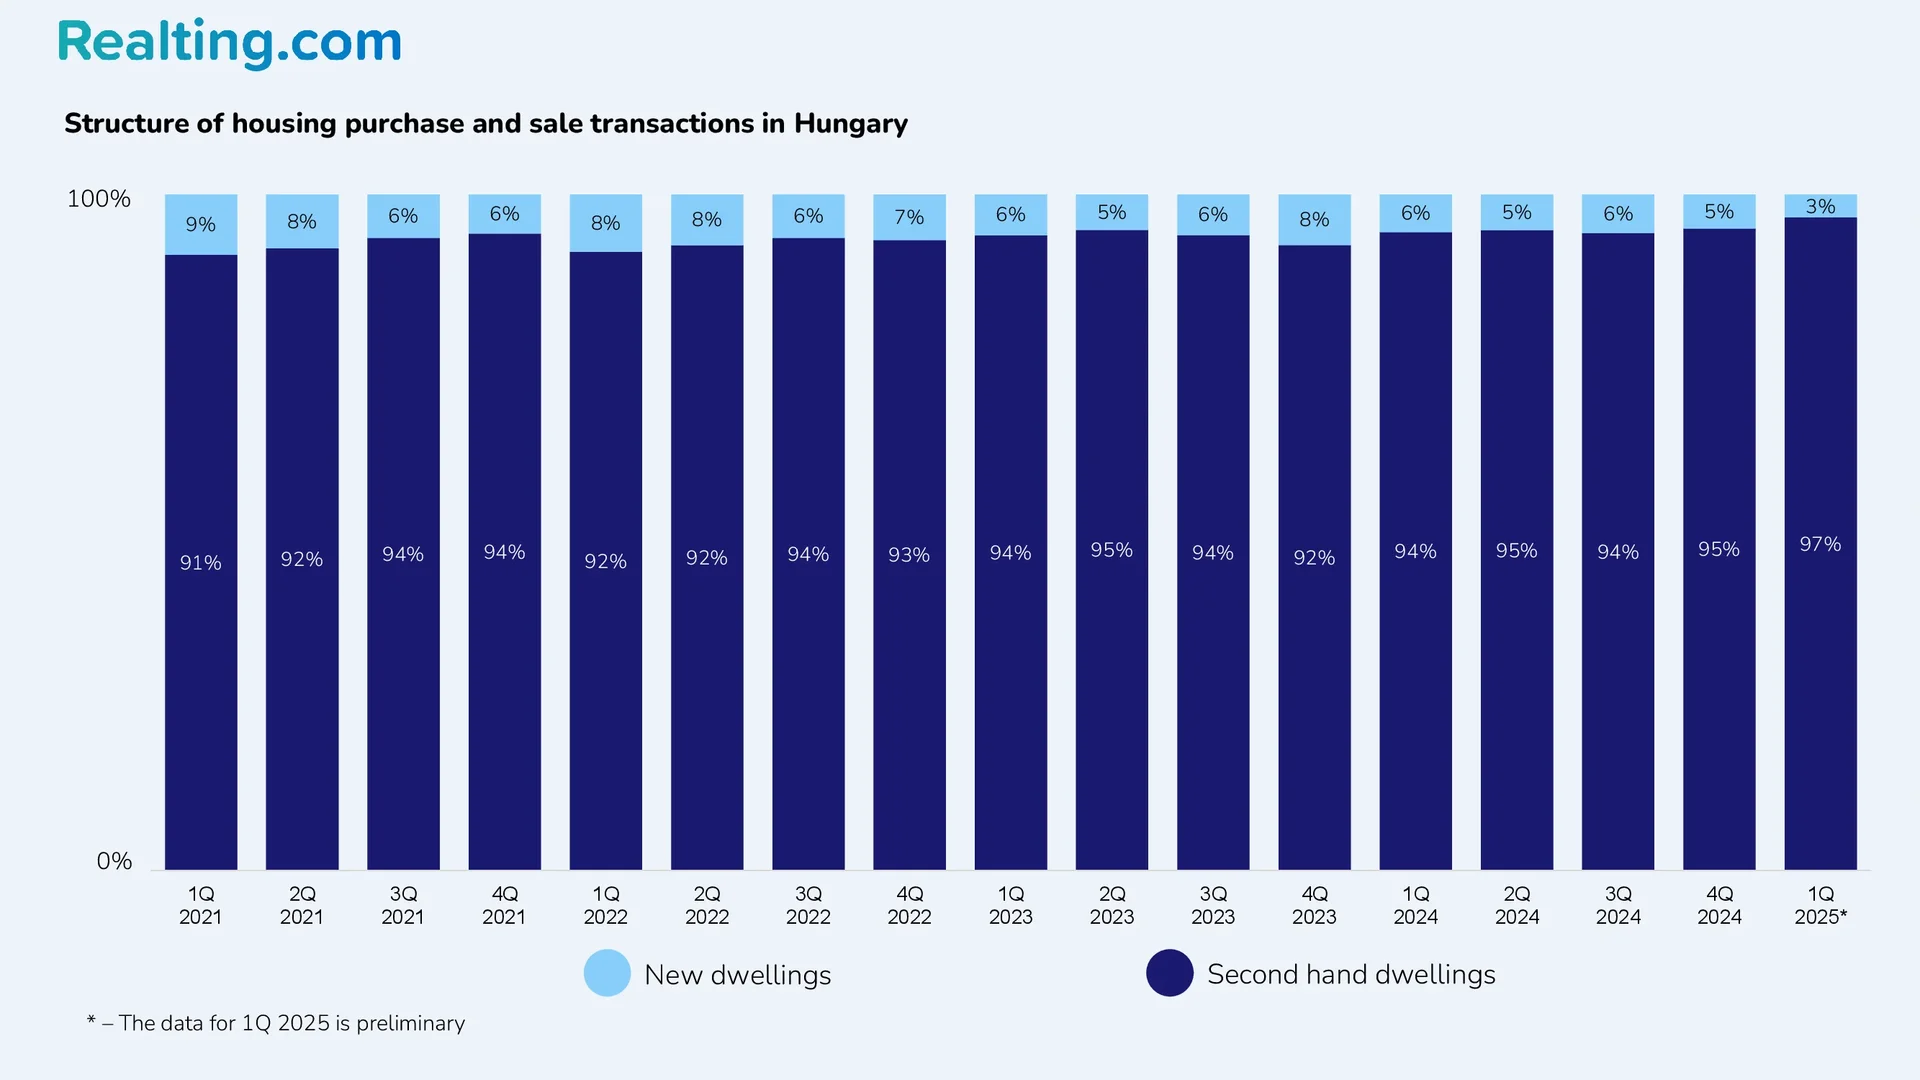
In 2024, new-build properties accounted for 5–6% of all quarterly transactions. In Q1 2025, the share of new housing dropped to just 3%.
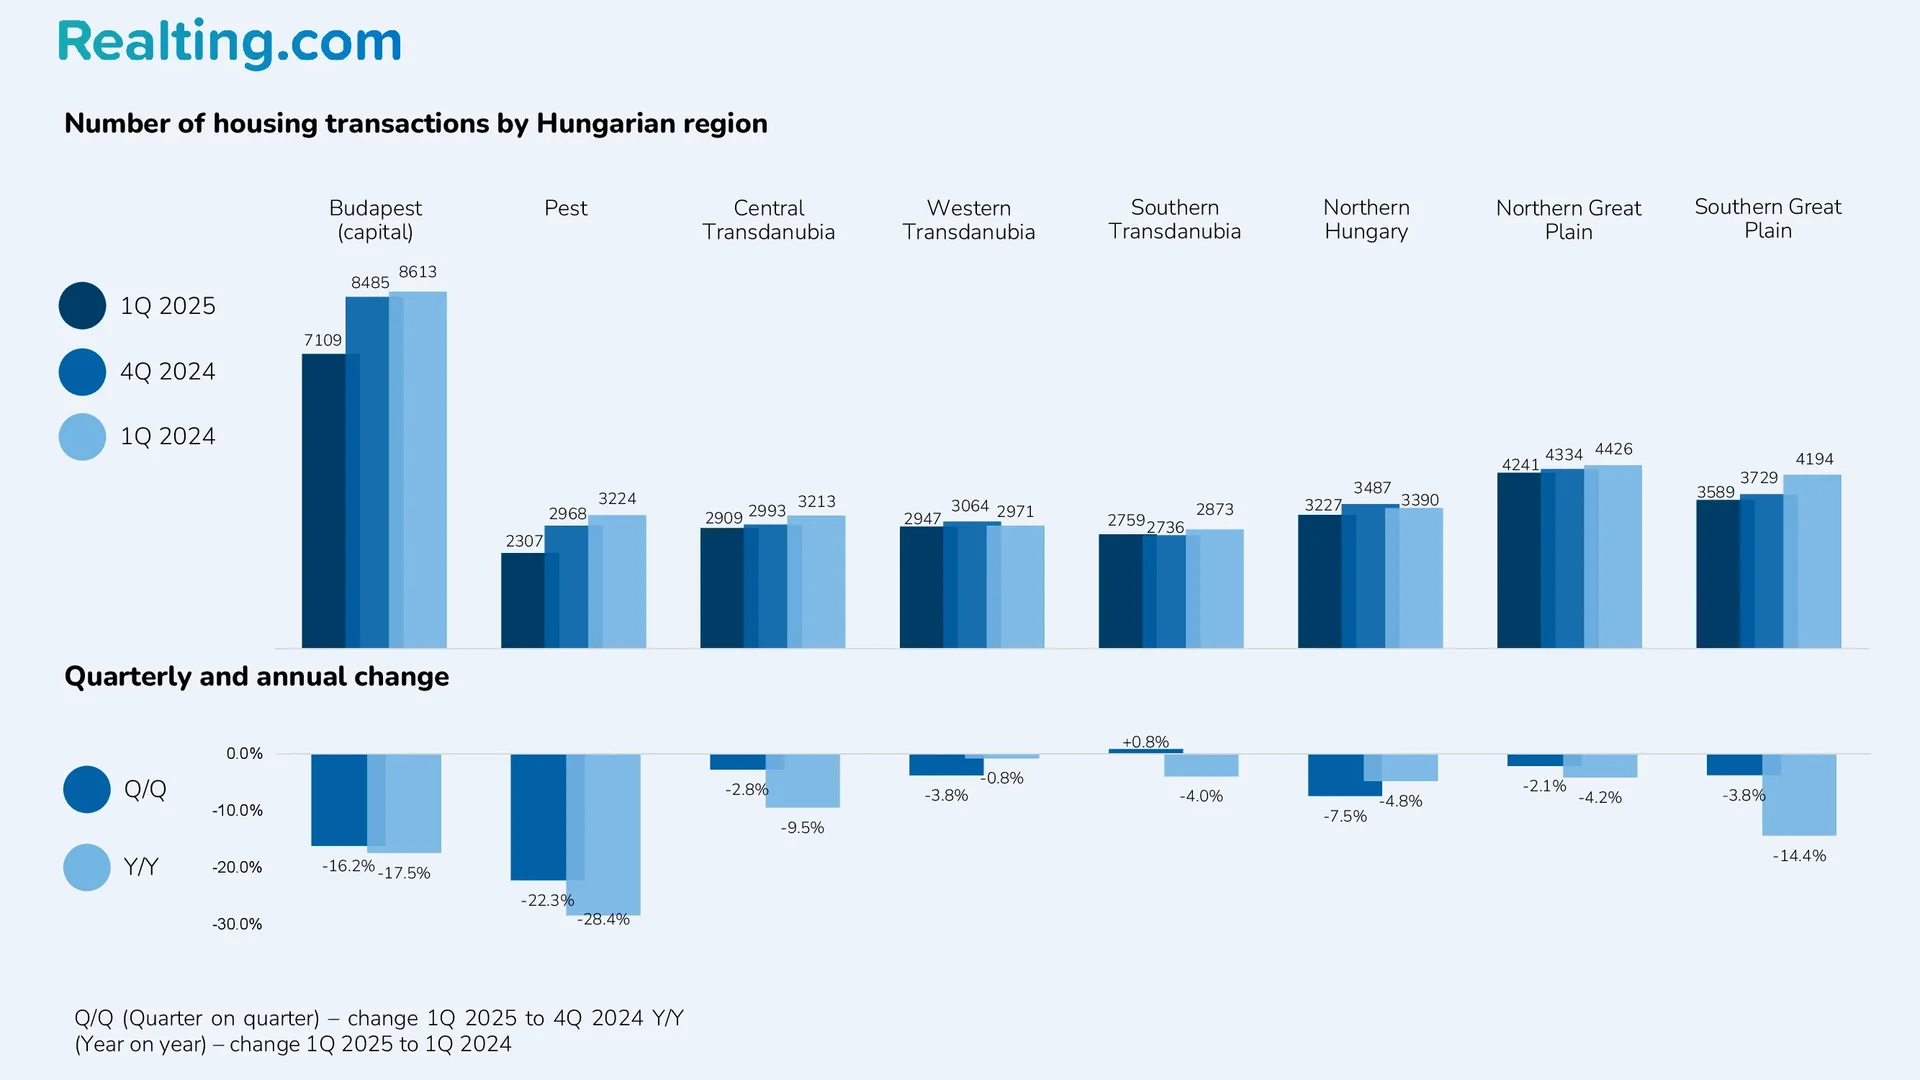
Preliminary data show that in Q1 2025, sales declined both YoY and QoQ in almost all regions, including the capital.
Regional Activity and Mortgage Lending
Budapest traditionally leads in the number of transactions. In Q1 2025, the capital recorded 7,109 transactions — down 16.2% QoQ and 17.5% YoY.
Among regions, the lowest activity was in Pest County (2,307 transactions) and Southern Transdanubia (2,759), while the highest (outside Budapest) was in Northern Great Plain (4,241) and Southern Great Plain (3,589).
Mortgage lending remains a key driver of housing market activity. According to the National Bank of Hungary (MNB), between January and September 2025, new housing loans totaled HUF 1,169.71 billion (€2,910.97 million) — up 16.6% YoY and 183.2% compared to January–September 2023 (when interest rates peaked and then began to fall).
From January to July 2025, monthly new mortgage volume exceeded HUF 120 billion but dropped to HUF 105.69 billion (€266.45 million) in August and HUF 112.64 billion (€287.51 million) in September. The decline is likely linked to tighter lending conditions and rising rates: the average weighted mortgage rate rose from 6.99% in January to 7.42% in September.
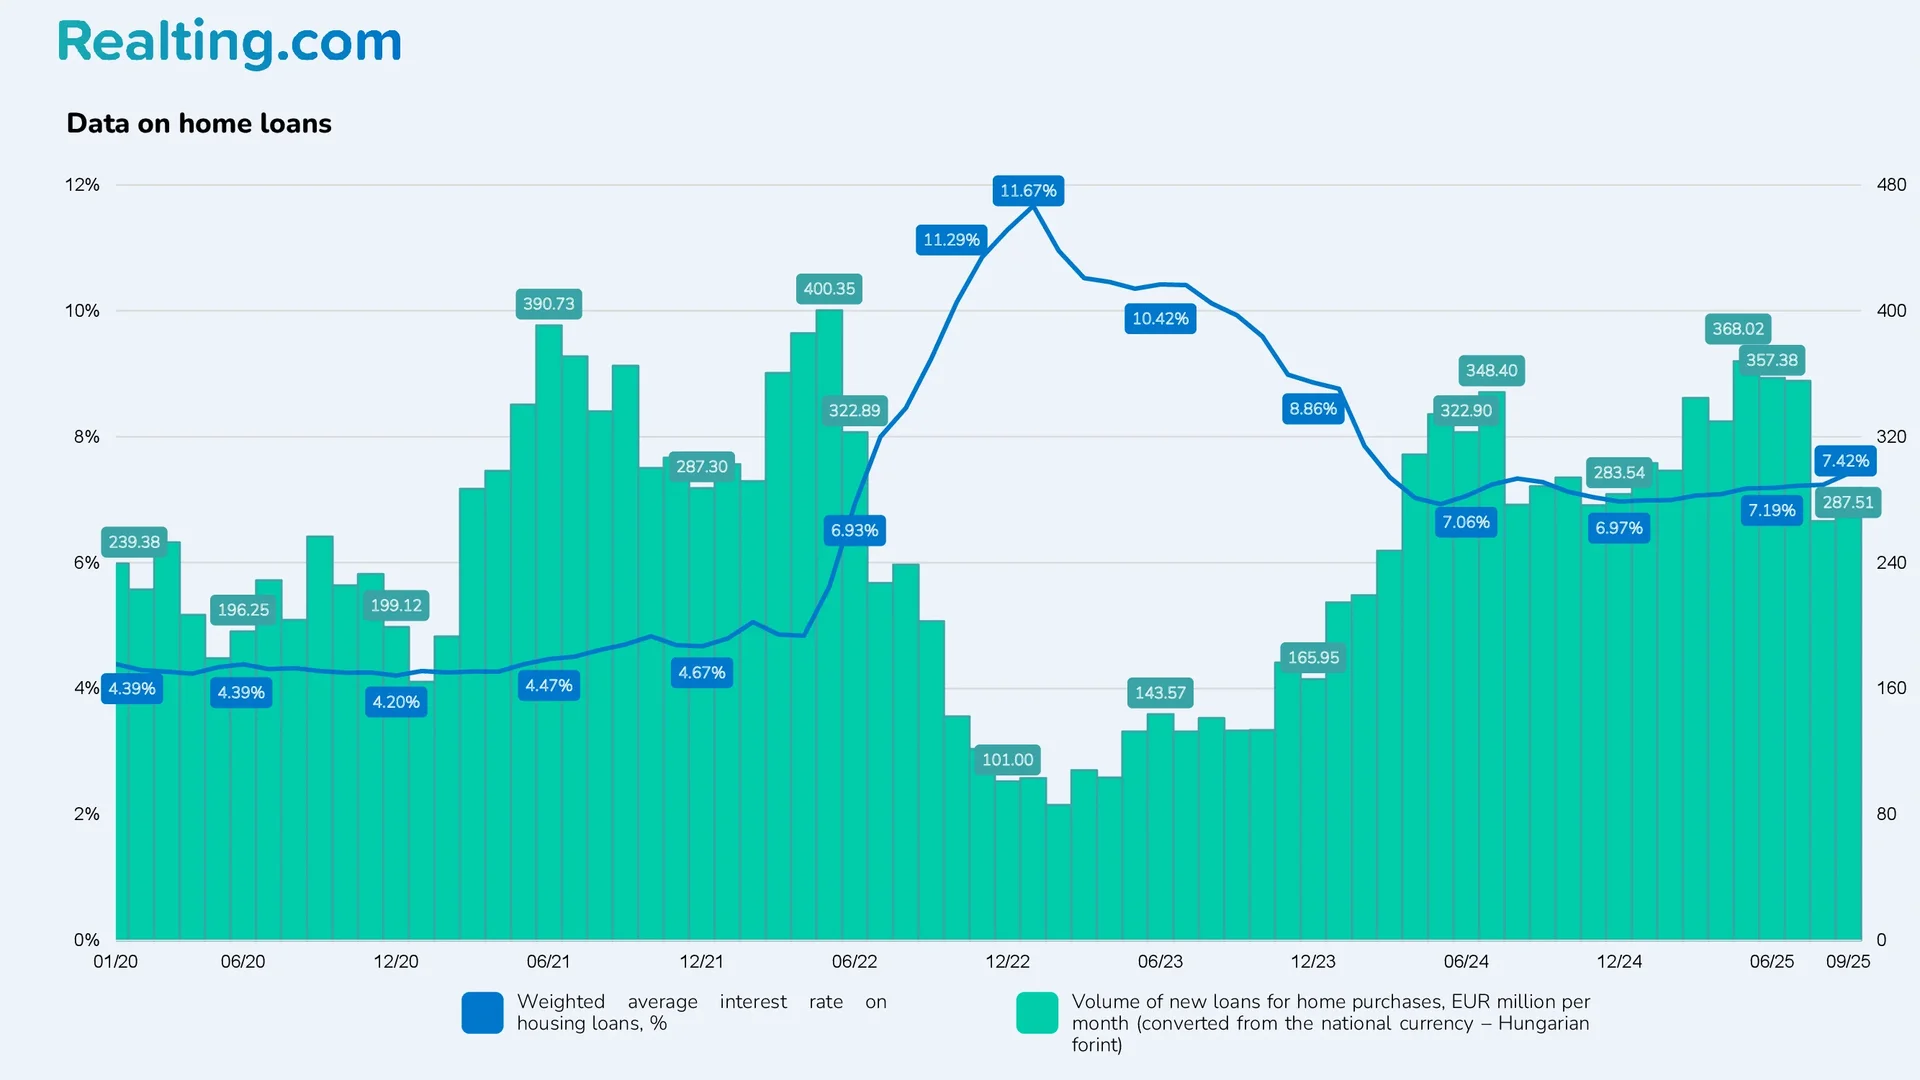
KSH reports 39,110 new housing loans issued in H1 2025 — up 3.6% from H2 2024 and 9.9% from H1 2024.
Structure of issued housing loans in H1 2025:
- 25,795 loans (66%) — purchase of existing apartments.
- 5,121 loans (13%) — construction of new housing.
- 3,699 loans (10%) — extension/renovation.
- 3,222 loans (8%) — purchase of new apartments.
- 864 loans (2%) — buyout of property.
- 409 loans (1%) — other.
Total volume in H1 2025: ~HUF 771.30 billion (+12.3% from previous half-year, +30.4% YoY).
The volume of loans is growing faster than the number of loans, indicating that price increases are the main driver.
Average loan size evolution:
- 2015: HUF 4.8 million (~€15,530).
- 2020: HUF 8.8 million (~€25,060).
- 2024: HUF 17.4 million (~€44,030).
Over less than a decade, the average loan size increased 3.63× in HUF (2.83× in EUR).
Average Property Prices in Hungary by Region
In Q2 2025, Hungary’s housing price index rose 3.5% quarter-on-quarter and 18.3% year-on-year, according to the Hungarian Central Statistical Office (KSH). It is worth noting that Hungary remains one of the EU leaders in housing price growth — since 2015, prices have more than tripled.
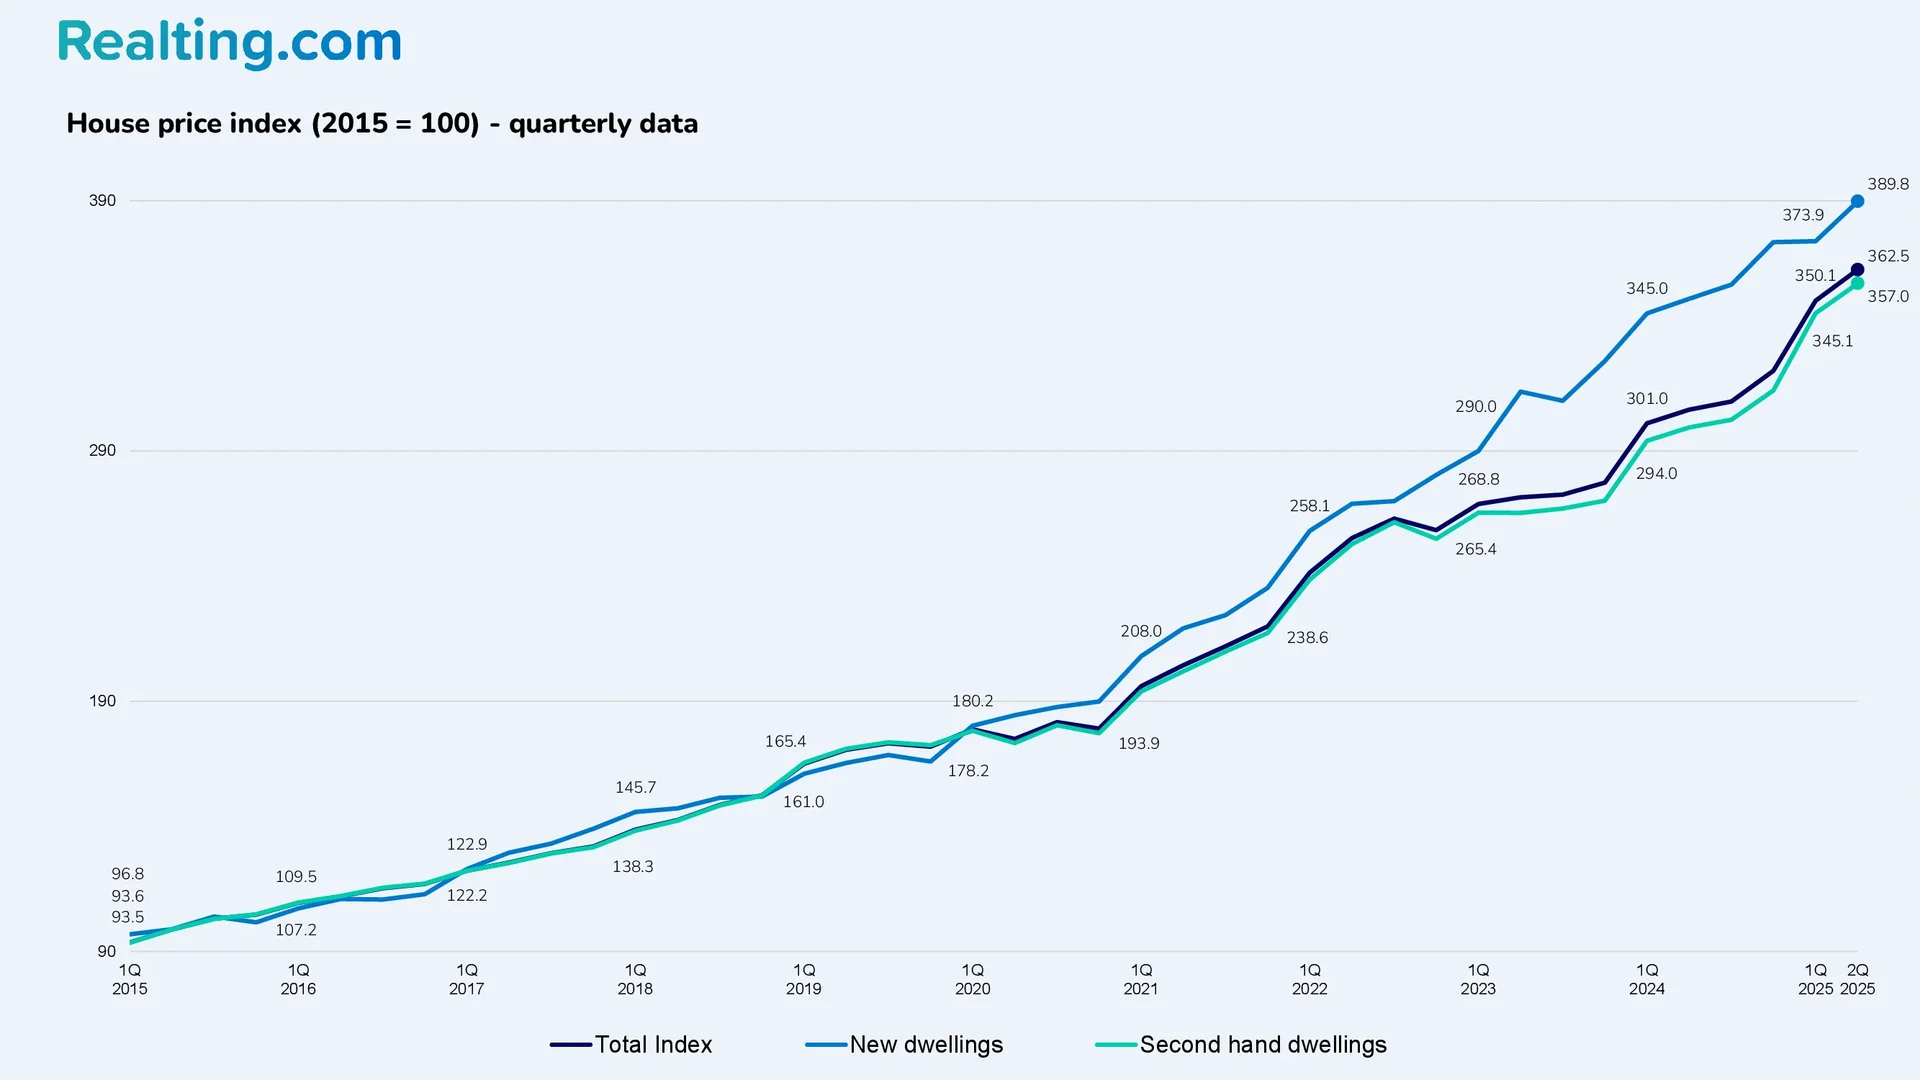
Price index breakdown by new-build and secondary-market housing:
- New-build housing price index in Q2 2025: 389.8 (+4.3% QoQ; +11.1% YoY).
- Secondary-market housing price index in Q2 2025: 357.0 (+3.4% QoQ; +19.2% YoY).
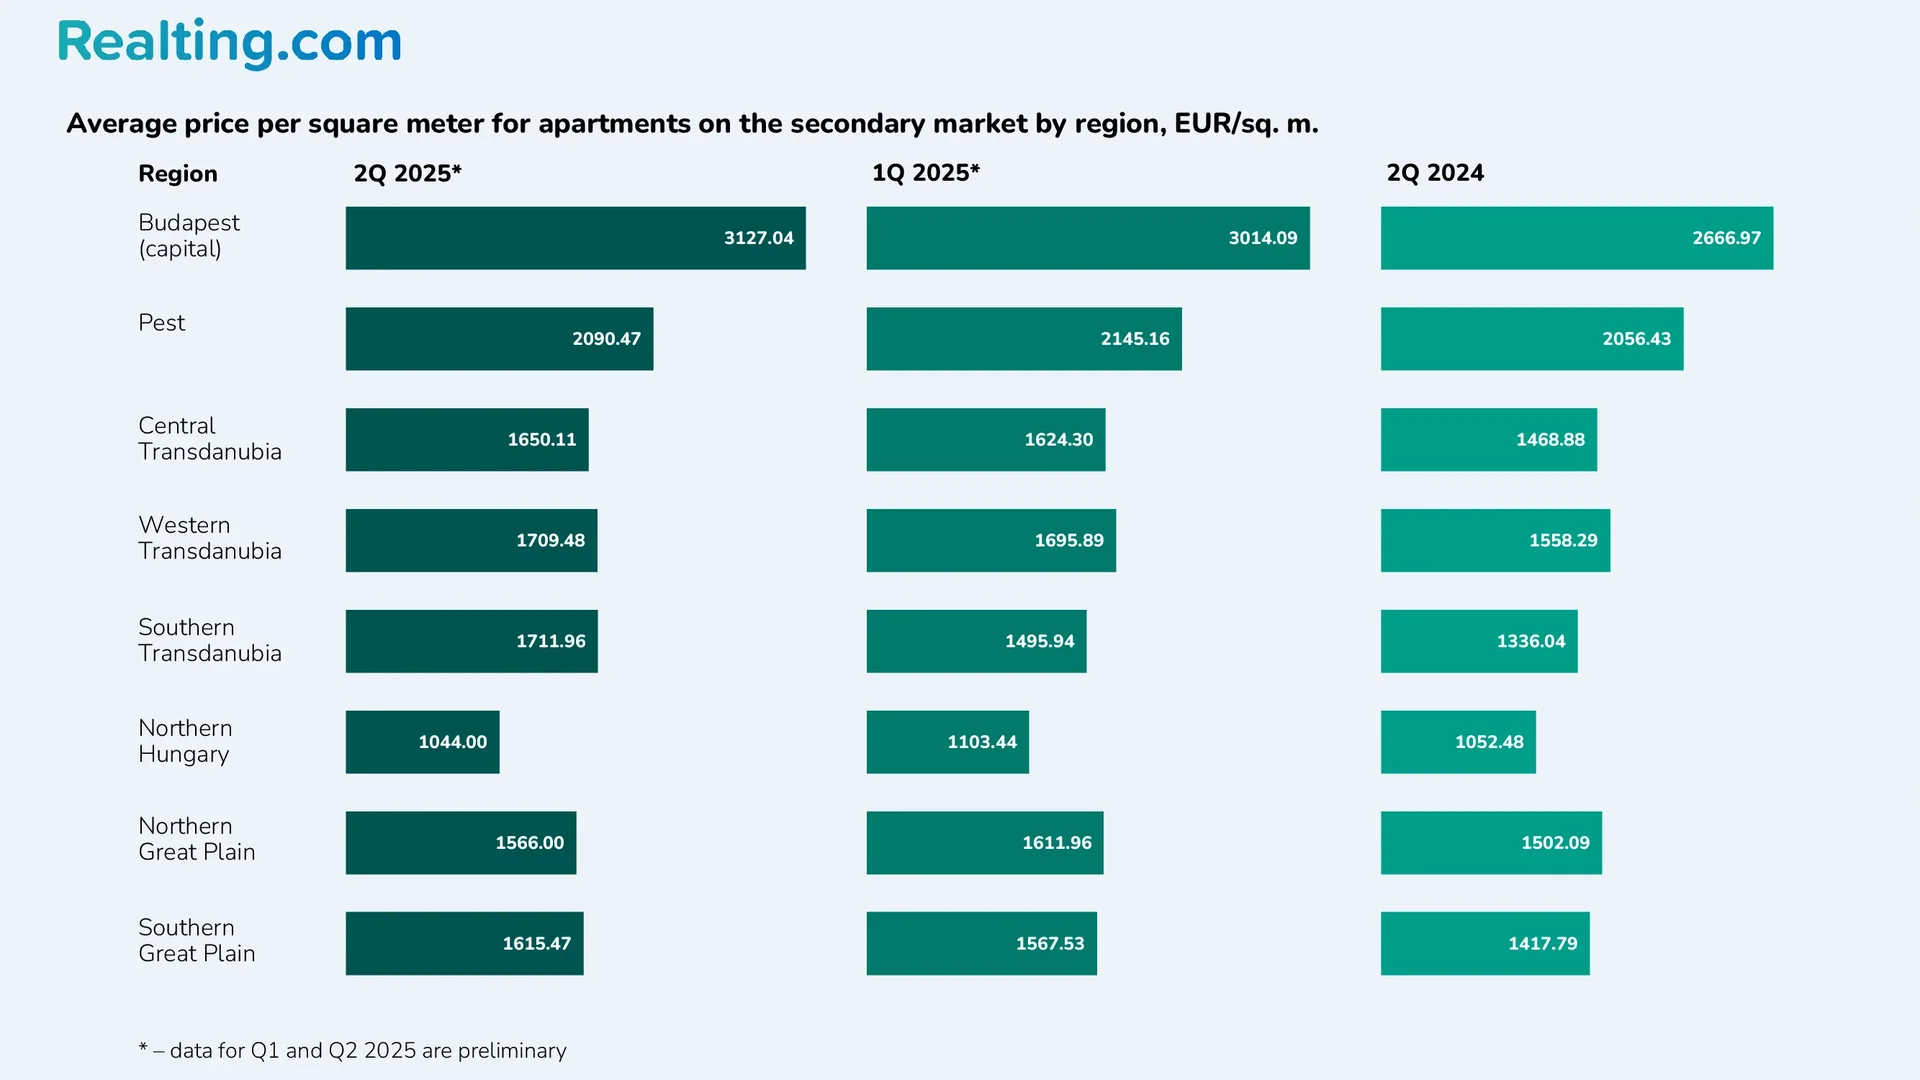
In national currency (HUF), the average price per square meter for secondary-market apartments increased year-on-year in every region of the country. The strongest growth was recorded in Southern Transdanubia (+32.31% YoY), while the smallest increase occurred in Northern Hungary (+2.43% YoY).
Average price per sqm for secondary-market apartments by region (Q2 2025)
|
Region |
Avg. price (HUF/sqm) |
QoQ change |
YoY change |
|
Budapest (capital) |
1,264,000 |
+3.52% |
+21.07% |
|
Pest |
845,000 |
-2.76% |
+4.97% |
|
Central Transdanubia |
667,000 |
+1.37% |
+16.00% |
|
Western Transdanubia |
691,000 |
+0.58% |
+13.28% |
|
Southern Transdanubia |
692,000 |
+14.19% |
+32.31% |
|
Northern Hungary |
422,000 |
-5.59% |
+2.43% |
|
Northern Great Plain |
633,000 |
-3.06% |
+7.65% |
|
Southern Great Plain |
653,000 |
+2.83% |
+17.66% |
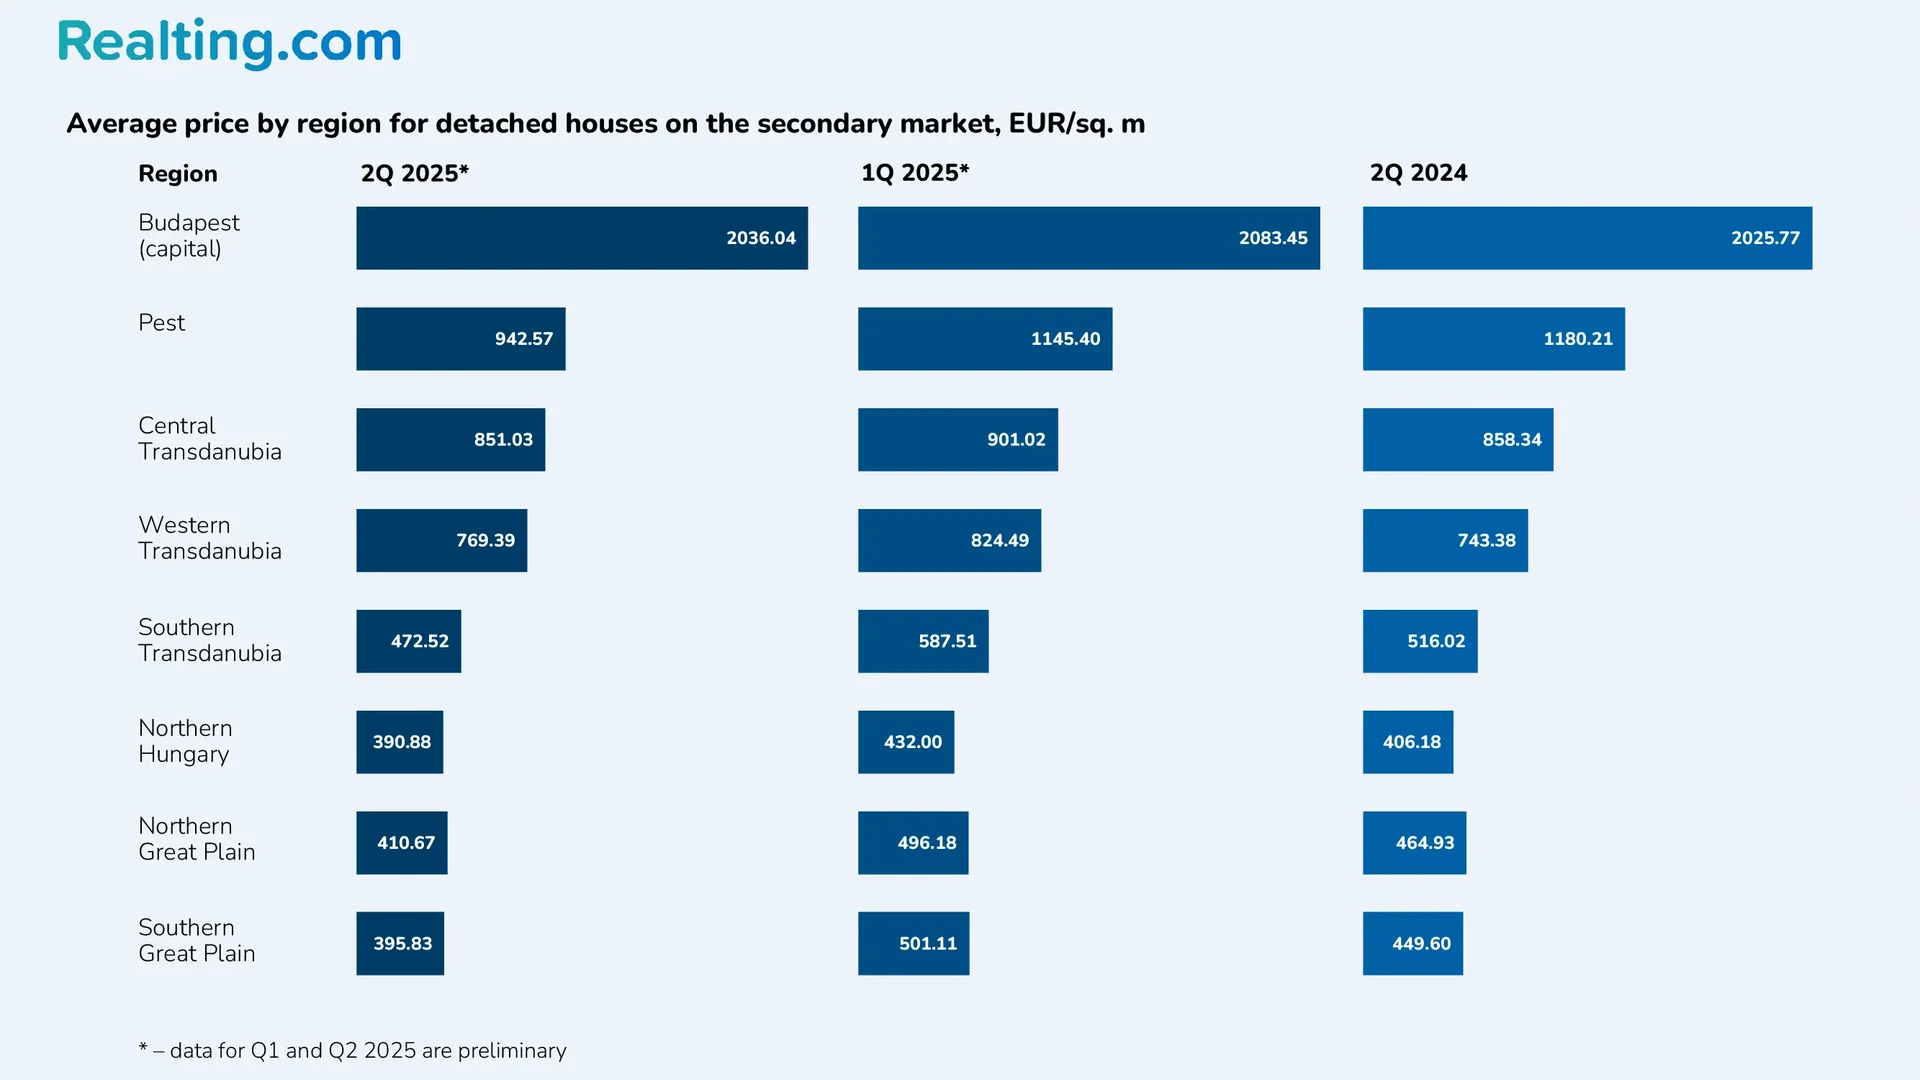
When it comes to detached (single-family) houses, the picture is different. In national currency, year-on-year price growth was recorded in only 3 out of 8 regions. The strongest increase occurred in Western Transdanubia (+6.9% YoY).
In the remaining 5 regions, average prices declined year-on-year, with the sharpest drop in Pest county, where the average price per square meter fell by 17.5% over the year.
Average price per sqm for detached houses (secondary market, Q2 2025)
|
Region |
Avg. price (HUF/sqm) |
QoQ change |
YoY change |
|
Budapest |
823,000 |
-2.5% |
+3.8% |
|
Pest |
381,000 |
-17.9% |
-17.5% |
|
Central Transdanubia |
344,000 |
-5.8% |
+2.4% |
|
Western Transdanubia |
311,000 |
-6.9% |
+6.9% |
|
Southern Transdanubia |
191,000 |
-19.7% |
-5.4% |
|
Northern Hungary |
158,000 |
-9.7% |
-0.6% |
|
Northern Great Plain |
166,000 |
-17.4% |
-8.8% |
|
Southern Great Plain |
160,000 |
-21.2% |
-9.1% |
The tables above presented average prices for secondary-market apartments and detached houses in Hungarian forints (HUF). Below, we provide the same prices converted into euros using the official exchange rate of the National Bank of Hungary.
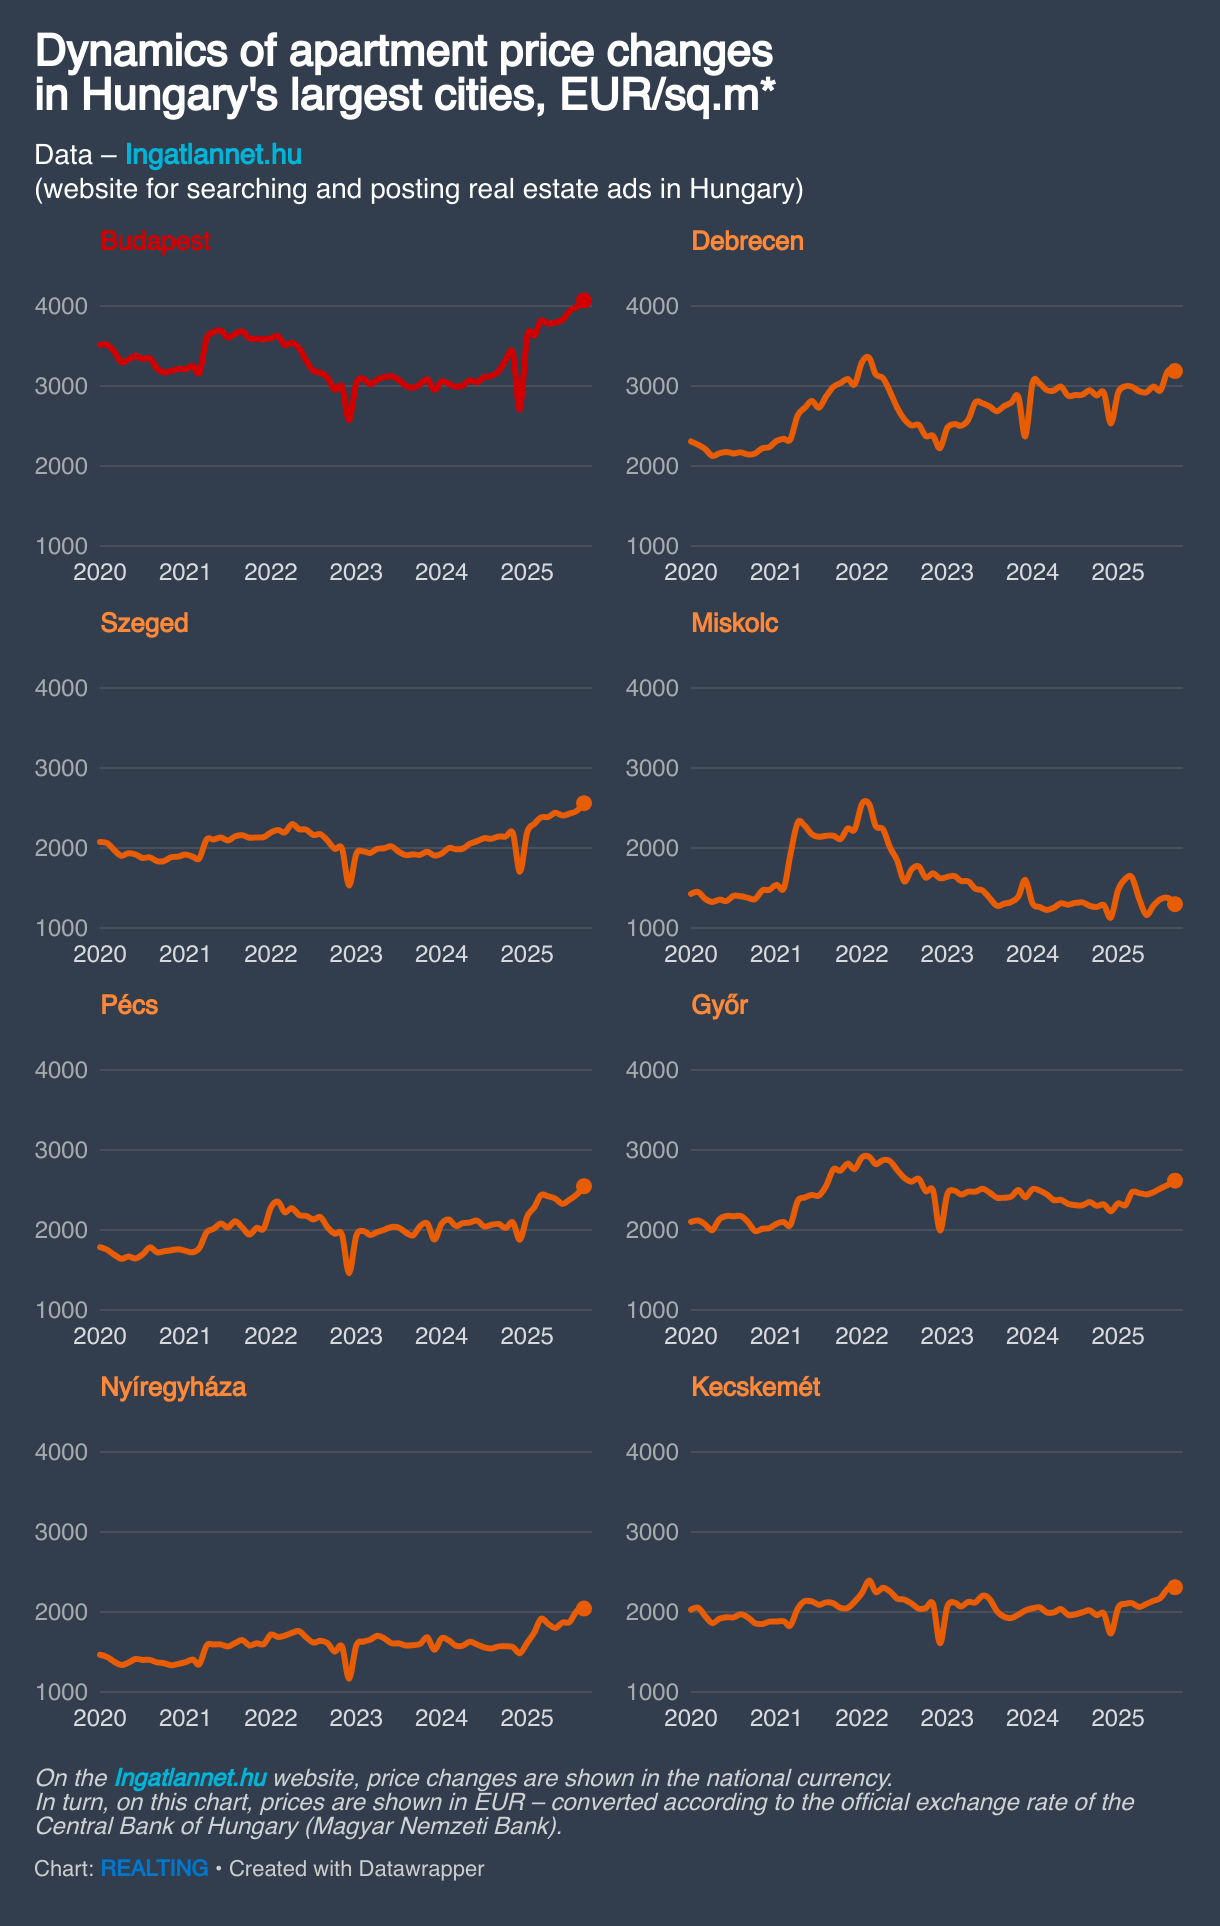
Average Asking Prices for Housing in Hungary’s Largest Cities
According to data from Ingatlannet.hu (Hungary’s leading real estate listing portal), asking prices for apartments rose year-on-year in all eight of the country’s largest cities.
The strongest growth was recorded in Nyíregyháza, where the average asking price per square meter increased by 29.1% over the year. Budapest came in second with a 26.7% rise.
Average asking price per square meter for apartments in Hungary’s largest cities – September 2025 (HUF/sqm)
|
City |
Avg. price (HUF/sqm) |
YoY change |
|
Budapest |
1,593,603 |
+26.7% |
|
Debrecen |
1,248,561 |
+7.3% |
|
Szeged |
1,003,253 |
+18.5% |
|
Miskolc |
508,504 |
+0.8% |
|
Pécs |
997,815 |
+21.8% |
|
Győr |
1,025,025 |
+10.5% |
|
Nyíregyháza |
800,531 |
+29.1% |
|
Kecskemét |
904,775 |
+13.4% |
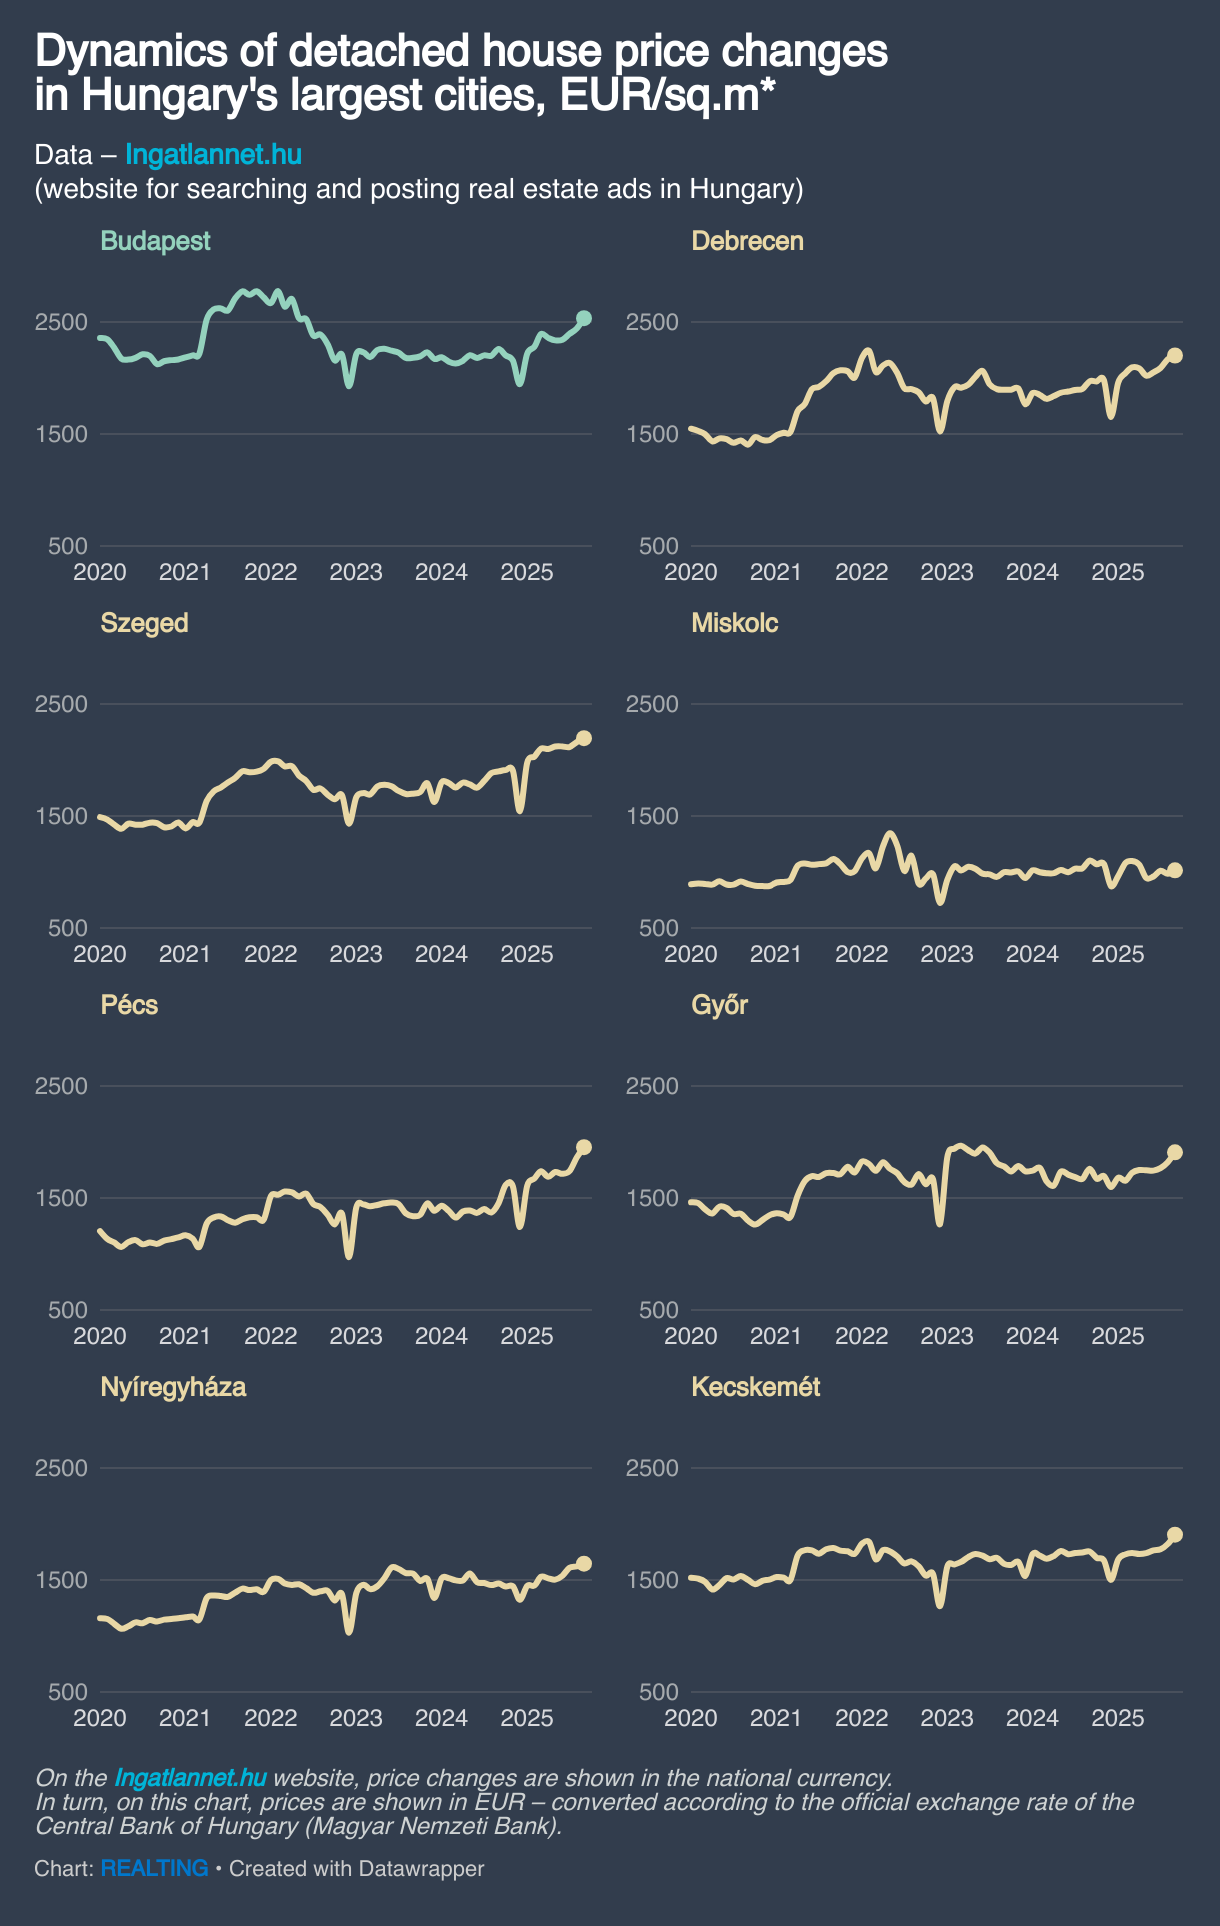
Year-on-year growth was also recorded in asking prices for detached houses. The clear leader was Pécs, where the average asking price per square meter rose by 33.3%. In the remaining major cities, annual growth did not exceed 15%, while in Miskolc house prices actually fell by 8.7% over the year.
Average asking price per square meter for detached houses in Hungary’s largest cities – September 2025 (HUF/sqm)
Detached houses (asking prices)
|
City |
Avg. price (HUF/sqm) |
YoY change |
|
Budapest |
992,982 |
+11.3% |
|
Debrecen |
862,213 |
+10.8% |
|
Szeged |
860,012 |
+14.7% |
|
Miskolc |
397,665 |
-8.7% |
|
Pécs |
765,614 |
+33.3% |
|
Győr |
747,290 |
+7.4% |
|
Nyíregyháza |
644,955 |
+11.3% |
|
Kecskemét |
746,292 |
+7.7% |
Conclusion
The Hungarian real estate market in the first half of 2025 is at a crossroads: the number of transactions fell 14.2%, signaling cooling demand, yet prices continue to rise at double-digit rates (+18.3% YoY), significantly outpacing wage growth (+6.1%).
The strongest price growth is observed in the apartment segment, especially in Budapest (+26.7%) and Southern Transdanubia (+32.3%), while the detached-house market is declining in most regions.
Mortgage lending remains the key market driver (€2.9 billion in the first 9 months), but rising interest rates to 7.42% and an average loan size of ~€44,000 are creating barriers for middle-income buyers. Future market dynamics will depend on the central bank’s monetary policy, economic growth rates, and households’ ability to service increasingly expensive housing.