From 2020 to 2025: How Much do Families Earn and How Much do They Spend in Montenegro — Official Review
The article presents official data from the Statistical Office of Montenegro (MONSTAT) on changes in average wages by sector, data on changes in the Consumer Price Index (CPI) for various goods and services, and the current cost and composition of the consumer basket according to the Center for Education, Information, and Trade Union Research of Montenegro (CEISI*).
— The Center for Education, Information, and Trade Union Research (CEISI) is an independent research and training center of the Union of Free Trade Unions of Montenegro (USSCG).
How Average Wages in Montenegro Changed from 2020 to 2025
Let’s start with average wage levels. MONSTAT regularly publishes statistics on changes in average gross wages by sector.
As of late October 2025, MONSTAT publications include data on average wages for August 2025.
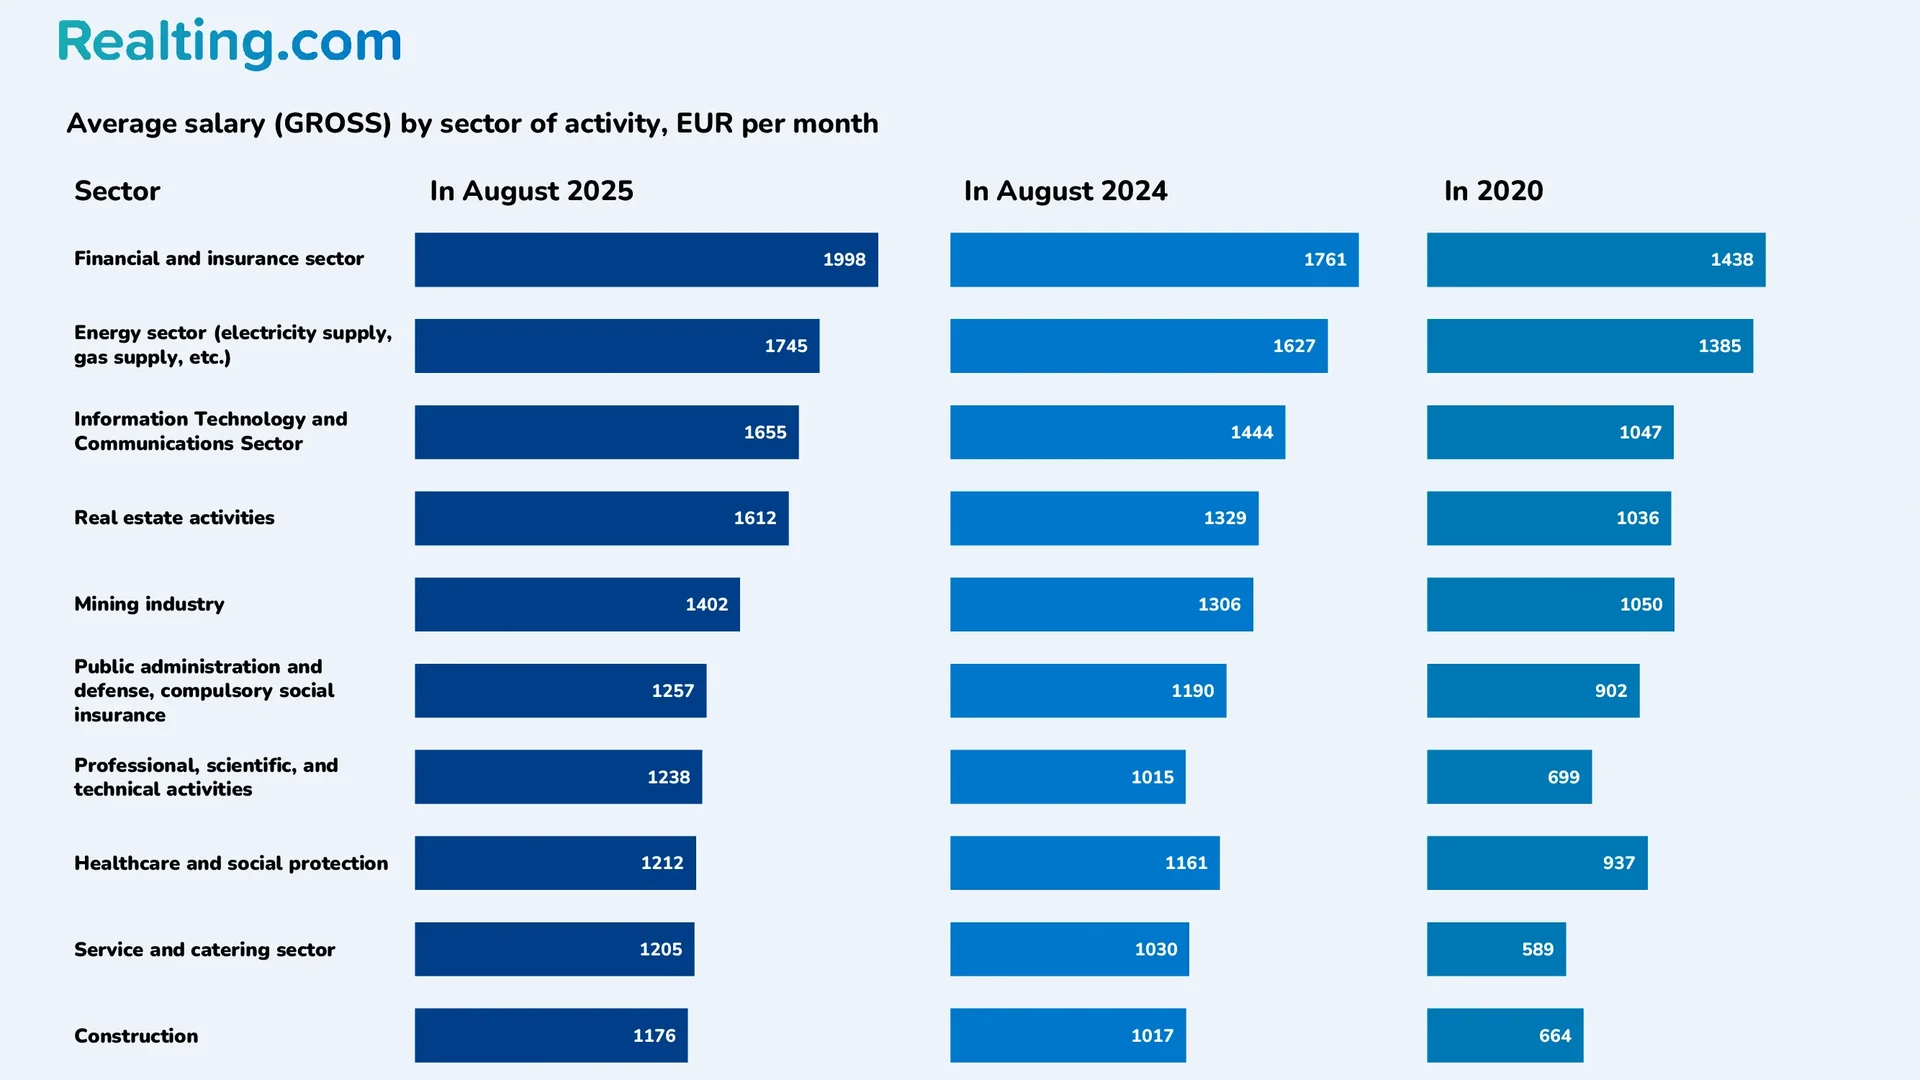
In August of this year, the average gross wage in Montenegro (without sector breakdown) was €1,210 per month, a 12.04% increase from August of the previous year. Compared to 2020, the average wage has grown by more than 1.5 times (+54.53%, to be precise).
When examining wages by sector, the lowest salaries (according to the Statistical Office) are in the following areas:
- Administrative and support services — average wage €1,008 per month;
- Manufacturing — €1,051 per month;
- Arts, entertainment, and recreation — €1,052 per month;
- Water supply, wastewater management, waste control, and similar activities — €1,076 per month;
- Agriculture, forestry, and fishing — €1,099 per month.
In contrast, the highest wages are in the financial and insurance sector, energy, and information technology. Below is a table of average gross wages in the 10 highest-paying sectors. Note that these figures represent the average wage across each sector nationwide in Montenegro.
What’s Included in Montenegro’s Trade Union Consumer Basket (TUCB) and How Much It Costs Today
Let’s examine the expense categories included in the consumer basket and their monetary value.
We use the Trade Union Consumer Basket (TUCB), defined and calculated by the Center for Education, Information, and Trade Union Research of Montenegro (CEISI).
According to CEISI methodology, the TUCB covers the living expenses of a family of four — two adults and two school-aged children (one child aged 10 attending primary school, the other aged 15 attending secondary school). The TUCB represents the cost of the minimum set of goods and services needed to meet a family’s basic needs for one month.
To quote CEISI’s methodology: The TUCB is based on the comparative experience and analysis of trade union members, whose needs and lifestyles closely align with consumer habits in Montenegro.
CEISI’s latest publications state that the total cost of the TUCB for Q3 2025 was €2,075. Compared to the previous quarter of 2025, the TUCB increased by 3.23%, or €65.
The consumer basket consists of 10 expense categories. The table below lists all categories, their costs (per CEISI) for Q3 2025, and comparisons with Q2 2025 and Q3 2024.
|
Expense category |
Cost, EUR per month |
Change in Q3 2025, % |
|||
|
Q3 2025 |
Q2 2025 |
Q3 2024 |
Q/Q |
Y/Y |
|
|
Food expenses |
645 |
630 |
605 |
+2.38% |
+6.61% |
|
Housing rent |
390 |
390 |
400 |
– |
-2.50% |
|
Household maintenance |
110 |
110 |
105 |
– |
+4.76% |
|
Housing and utilities |
255 |
245 |
240 |
+4.08% |
+6.25% |
|
Clothing and footwear |
100 |
100 |
110 |
– |
-9.09% |
|
Personal hygiene and health items |
135 |
135 |
135 |
– |
– |
|
Transportation |
100 |
100 |
100 |
– |
– |
|
Education and culture |
135 |
105 |
110 |
+28.57% |
+22.73% |
|
Sports and recreation |
70 |
70 |
70 |
– |
– |
|
7-day family vacation (summer) |
135 |
125 |
125 |
+8.00% |
+8.00% |
|
Total |
2075 |
2010 |
2000 |
+3.23% |
+3.75% |
In the context of this consumer basket, note that it is not comprehensive and excludes certain expenses. For example, the TUCB does not include costs for owning and maintaining a car; transportation expenses cover public transport only. Solid fuel costs (firewood, coal, etc.) are also excluded, though they represent a significant expense for households in northern Montenegro.
Alcoholic beverages and tobacco products are not included in the TUCB. However, in most global consumer basket definitions, these categories are excluded as non-essential for living.
Consumer Price Index (CPI) in Montenegro: Inflation Overview and Changes Over 5 Years
Now let’s examine how prices for goods and services in Montenegro have changed since 2020 using the Consumer Price Index (CPI). The CPI measures average price changes for all goods and services consumed by households, tracking inflation and price level shifts over time.
In September 2025, annual inflation in Montenegro was 4.9% — the highest since May 2024. The CPI stood at 143.44 (with 2015 = 100).
From September 2020 to September 2025, the CPI rose by 36.47%.
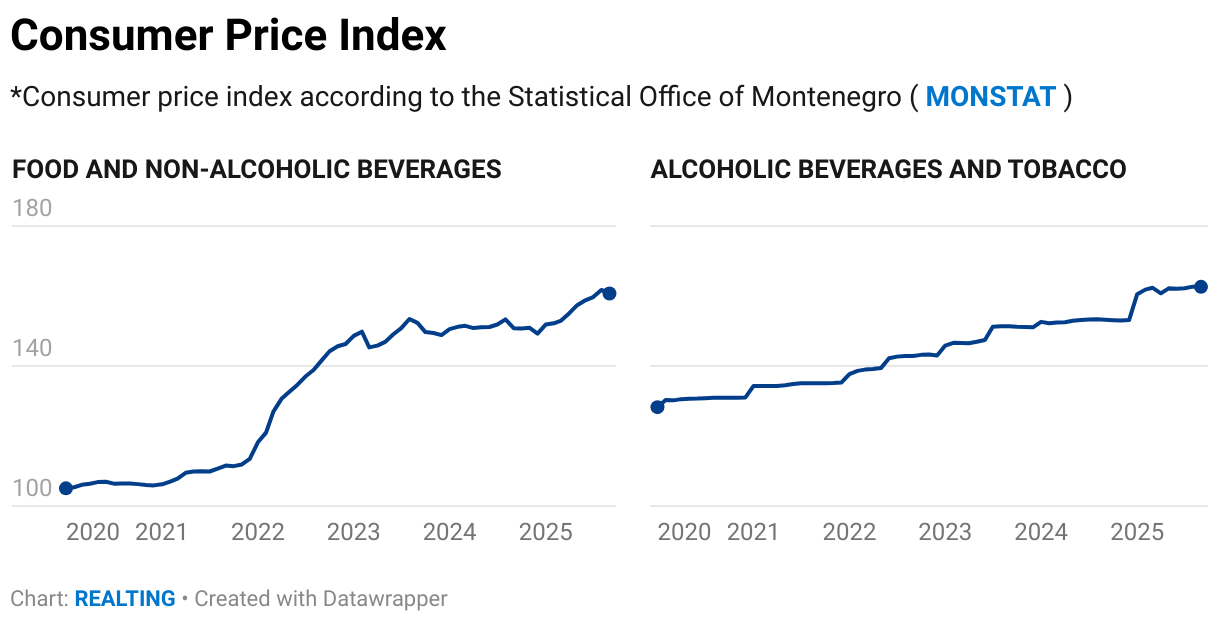
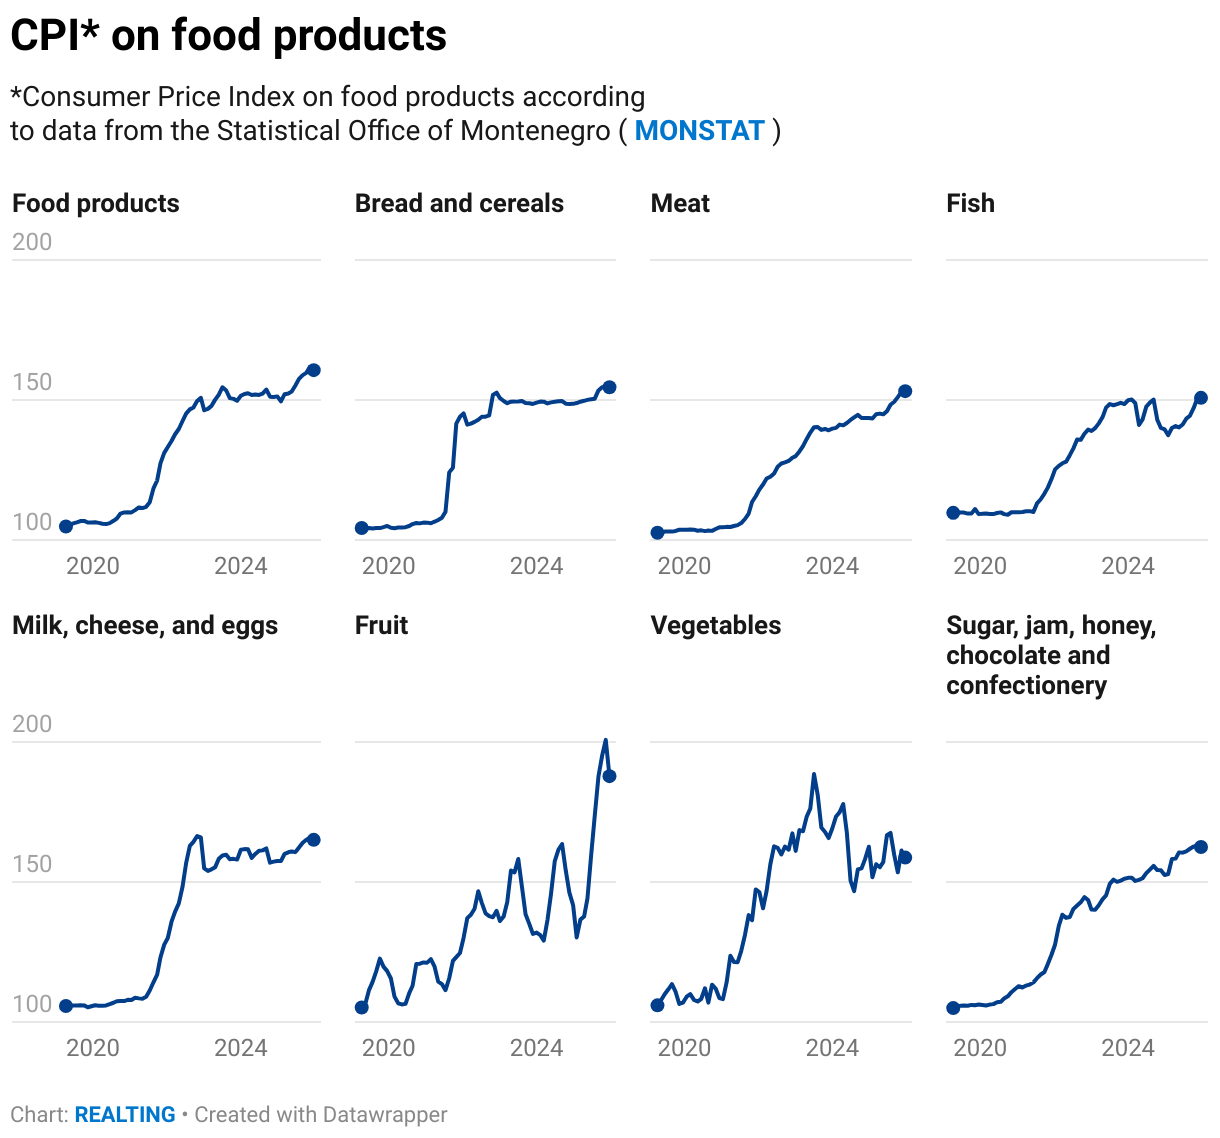
Food and non-alcoholic beverage prices increased by 51.08%, while alcohol and tobacco prices rose by 24.20%.
Among food categories, the largest price increase was in «vegetable oils and fats» — +71.54% compared to September 2020. The smallest increase was in «fish» — +37.87%.
CPI changes for select food categories since September 2020:
- Bread and cereals — +48.13%.
- Meat — +47.72%.
- Milk, cheese, eggs — +55.72%.
- Fruits — +62.55%.
- Vegetables — +45.55%.
- Sugar, jam, honey, chocolate, and confectionery — +53.18%.
For visual comparison, below is a chart showing CPI changes for food products in Montenegro over 5 years.
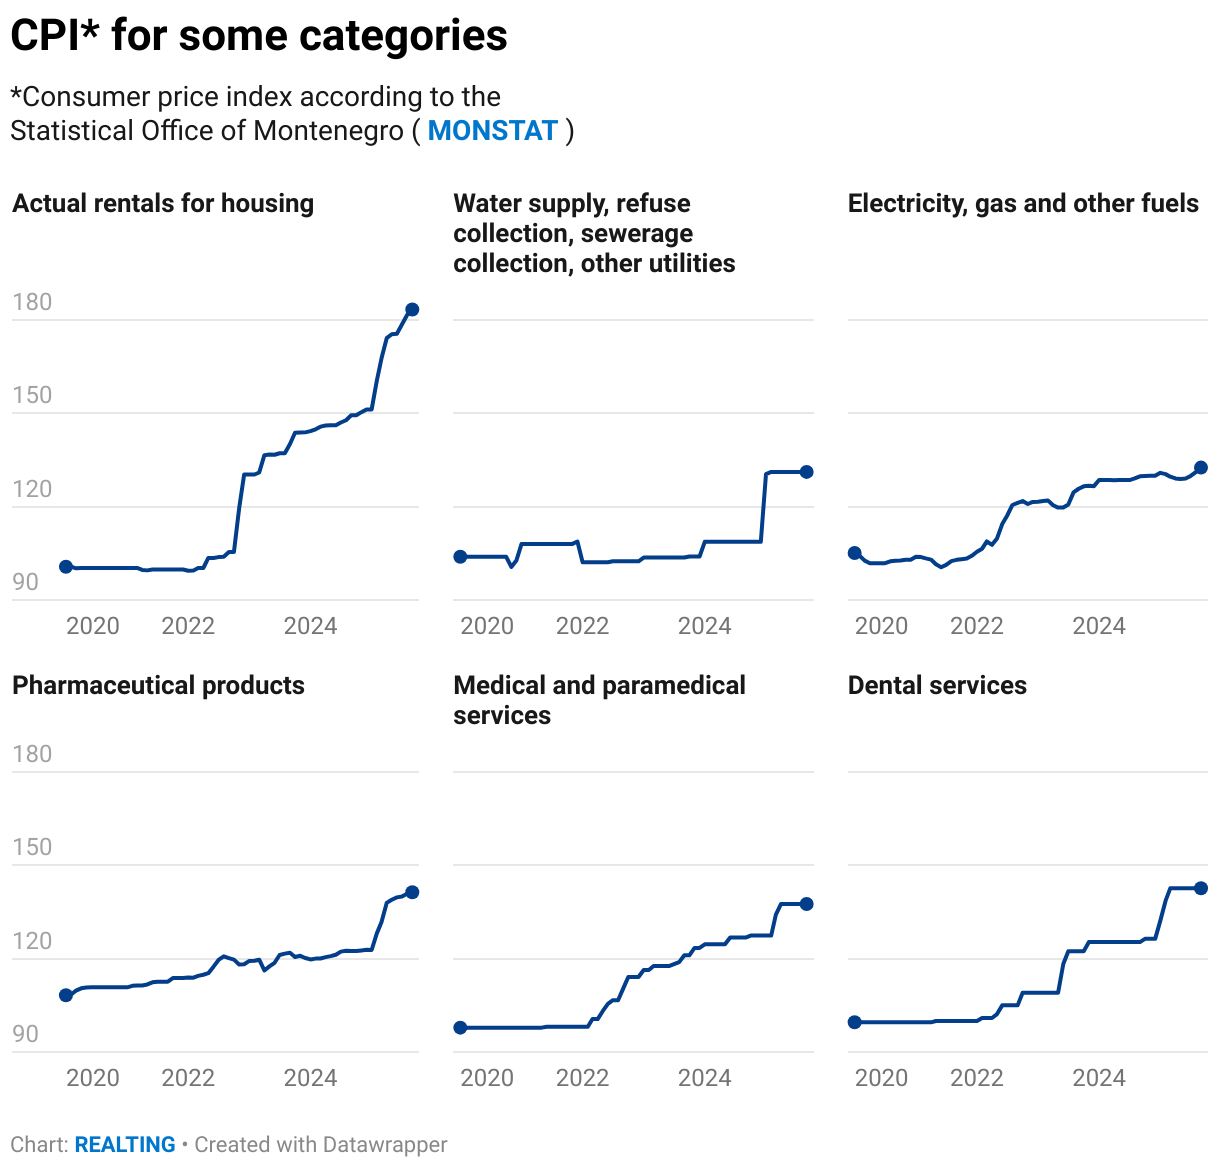
Among non-food categories, «actual rent» showed one of the largest increases, rising 82.58% over 5 years according to MONSTAT.
Price changes for other key non-food categories:
- Water supply, waste removal, sewerage, and other utilities — +26.26%.
- Electricity, gas, and other fuels — +29.13%.
- Pharmaceutical products — +27.56%.
- Medical and paramedical services — +40.64%.
- Dental services — +43.27%.
Below is a chart showing CPI changes for the above categories since 2020.
Current Food Prices in Montenegro
We’ve compiled a table of current prices for various food items in Montenegro as of the article’s publication date, sourced from local retail delivery websites.
|
Category |
Price, EUR |
From – To, average |
|
Bread and Cereals |
||
|
Bread (300–500 g) |
0.85 – 1.99 |
1.34 |
|
Pasta (500 g) |
0.89 – 2.19 |
1.42 |
|
Rice (0.4–1 kg) |
1.35 – 6.25 |
3.69 |
|
Meat |
||
|
Chicken fillet (1 kg) |
4.79 – 9.59 |
7.79 |
|
Chicken drumstick (1 kg) |
4.59 – 4.99 |
4.79 |
|
Beef (boneless shoulder, 1 kg) |
8.99 – 11.99 |
10.52 |
|
Pork (boneless shoulder/neck, 1 kg) |
4.79 – 6.29 |
5.82 |
|
Milk, Cheese, and Eggs |
||
|
Milk (1 L) |
1.00 – 2.09 |
1.53 |
|
Sour cream (400 g) |
1.29 – 1.95 |
1.62 |
|
Butter (200–250 g pack) |
3.89 – 5.75 |
4.73 |
|
Local cheese (1 kg) |
5.5 – 12.3 |
8.5 |
|
Chicken eggs (10 pcs) |
2.09 – 3.35 |
2.64 |
|
Vegetable Oils |
||
|
Sunflower oil (1 L) |
1.49 – 1.85 |
1.62 |
|
Olive oil (0.5 L) |
8.29 – 18.49 |
13.47 |
|
Fruits |
||
|
Apples |
0.8 – 2.00 |
1.38 |
|
Pears |
1.79 – 2.89 |
2.34 |
|
Grapes |
1.69 – 2.39 |
2.04 |
|
Oranges |
0.89 – 2.40 |
1.64 |
|
Vegetables |
||
|
Potatoes (1 kg) |
0.59 – 1.10 |
0.77 |
|
Tomatoes (1 kg) |
2.09 |
– |
|
Carrots (1 kg) |
0.65 – 1.69 |
1.17 |
|
Tomatoes (1 kg) |
1.30 – 3.00 |
2.01 |
|
Cucumbers (1 kg) |
1.69 |
– |
|
Peppers (1 kg) |
1.49 – 1.69 |
1.59 |
|
Cabbage (1 kg) |
0.35 |
– |
|
Onions (1 kg) |
0.60 – 1.50 |
0.92 |
Note that purchasing fruits and vegetables at markets, depending on seasonality, can be significantly cheaper than in supermarkets. The same applies to fish, especially in coastal or nearby areas.