
Europe Housing Market in 2025: House Prices by Country
On April 7, 2026, Eurostat published housing price data for the fourth quarter of 2025, effectively providing the statistical year-end results for the European residential real estate market in 2025.
The assessment is based on the House Price Index, or HPI, which reflects changes in residential property prices and is calculated using a methodology comparable across EU countries. In this case, the comparison is between the fourth quarter of 2025 and the fourth quarter of 2024, meaning it shows the year-on-year change in housing prices by the end of 2025.
We analyzed Eurostat’s data to explain how the European housing market ended 2025, how wide the differences between individual countries were, and what caused them.
How Europe ended 2025 in terms of housing prices
The analysis is based on the House Price Index, or HPI, which Eurostat uses to compare changes in residential property prices across countries.
The indicator reflects changes in prices for residential properties, including both new and existing homes. It covers apartments, detached houses, townhouses, and other types of residential real estate, regardless of their future use or of who previously owned the property.
The year-on-year change in HPI in the fourth quarter of 2025 compared with the fourth quarter of 2024 shows the price level at which the market ended the year and provides a clearer picture of current market conditions than an abstract annual average.
By the end of 2025, Europe’s housing market as a whole remained in growth territory. According to Eurostat, in the fourth quarter of 2025 housing prices increased by 5.5% in the EU and by 5.1% in the euro area compared with the same quarter of 2024. Compared with the third quarter of 2025, prices also continued to rise, by 0.8% in the EU and by 0.6% in the euro area.
At the same time, the pan-European picture shows that the housing market developed very unevenly. The gap between countries remained substantial, while the aggregate statistics combined economies that were in different phases of the price cycle.
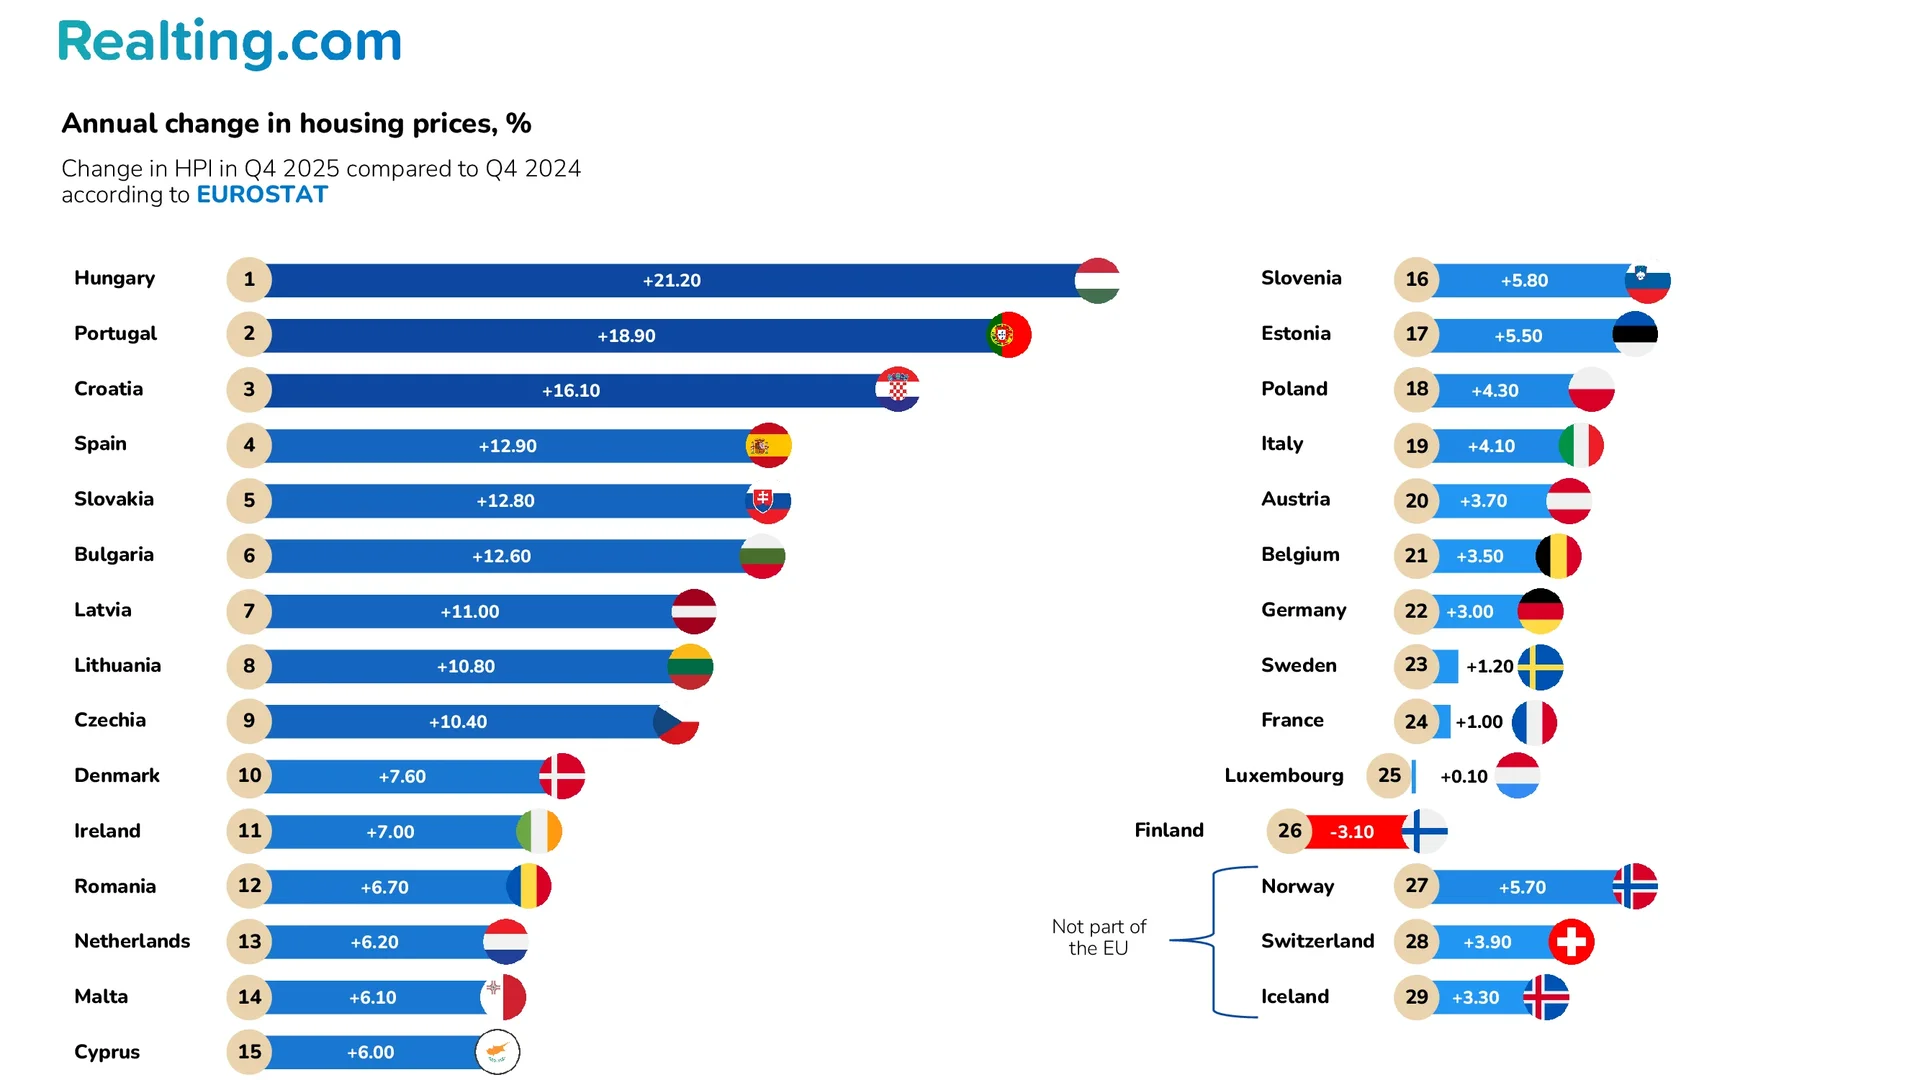
The chart shows that although the headline year-on-year increase was 5.5%, the variation within that aggregate figure was very wide, ranging from -3.1% in Finland to +21.2% in Hungary.
Based on the chart itself, the countries can logically be divided into at least three groups.
- The first group includes fast-growing markets, where annual price growth had already reached double digits. This group includes Hungary, Portugal, Croatia, Spain, Slovakia, Bulgaria, Latvia, Lithuania, and the Czech Republic.
- The second group consists of countries with strong but no longer extreme growth, roughly in the 5% to 8% range. These include Denmark, Ireland, Romania, the Netherlands, Malta, Cyprus, Slovenia, Estonia, as well as Norway outside the EU.
- The third group includes markets with more moderate dynamics, where growth was already close to stagnation. These are Poland, Italy, Austria, Belgium, Germany, Sweden, France, Luxembourg, Switzerland, and Iceland.
- Finland stands apart, as it was the only EU country where housing prices declined.
This distribution suggests that in 2025 local factors were already playing the decisive role. These included supply shortages, differences in mortgage affordability, varying investment appeal, and different levels of sensitivity of national markets to domestic demand.
This conclusion is also supported by the geography of the fastest-growing markets. The strongest price increases were seen in countries where the housing market combined limited supply with resilient demand, including the tourist- and investment-attractive economies of Southern Europe.
Why price dynamics were so uneven
The gap between countries is primarily explained by the fact that in 2025 the European housing market was emerging from the period of expensive credit at different speeds. As early as the fourth quarter of 2022, banks reported an expected net balance of mortgage demand at -64%, and in the fourth quarter of 2023 it still stood at -26%.
In 2024 and 2025, this situation began to change, and the ECB’s key rate declined from 4.0% in June 2024 to 2.0% by June 2025. Against this backdrop, credit conditions gradually eased, and mortgage demand began to recover. By the fourth quarter of 2024, the net balance of demand for housing loans had reached +42%.
The recovery in demand had different effects across countries because housing supply remained constrained. As a result, markets quickly ran into a shortage of new homes.
Portugal is one of the clearest examples of this combination. According to the Bank of Portugal, housing prices there were rising by about 17% year on year in the first half of 2025.
At the same time, the regulator emphasized that in 2015 to 2024 new housing construction was roughly half the level seen in the previous eight years. This helps explain why Portugal ended up near the top of the chart with growth of around 19%. Demand accelerated, while supply remained structurally weak.
Spain shows a similar pattern, although with some differences. In its Spring 2025 Financial Stability Report, the Bank of Spain stated directly that real house prices were rising because demand was outpacing supply. In 2024, the volume of new mortgages for home purchases increased by 34.6% year on year, and in the first quarter of 2025 it had already risen by 39.9%.
The market received a strong influx of new credit-driven demand, while supply was unable to respond at the same pace. That is why Spain stands well above the EU average on the chart.
In Hungary, the volume of new housing loans increased by 26% year on year in the first half of 2025, while the share of home purchases financed with credit approached 40%. However, the regulator also noted that the market was overvalued by about 18.8% nationwide. In other words, growth in Hungary was being driven by three factors at once: credit demand was recovering, supply was constrained, and the market itself was already moving into an overheating phase.
At the other end of the spectrum is Finland, where floating-rate mortgages are widespread, so higher rates are reflected in monthly payments almost immediately. The average rate on outstanding housing loans there rose from 1.0% in January 2019 to 4.1% in December 2023. For the market, this meant a rapid and severe cooling of demand.
The weak performance in parts of Western and Northern Europe can be explained by the fact that more mature markets reacted earlier to the period of expensive credit. As a result, by the end of 2025 growth in Germany, France, Sweden, Luxembourg, and Finland had either slowed sharply or turned negative.
By contrast, in countries where limited supply coincided with recovering mortgage demand and stronger investment demand, prices rose much faster than the EU average.
To sum up
The results for 2025 show that the European housing market has entered a phase of steady but uneven growth. When a single statistical space includes a decline in Finland, near-zero growth in Luxembourg, and double-digit price increases in Hungary at the same time, it means that national markets are no longer moving through the same cycle.
This leads to the conclusion that the average 5.5% increase in EU housing prices is the result of averaging very different trajectories. At the top of the distribution are markets where growth is two to four times higher than the EU average. At the bottom are countries where growth is close to zero or negative.
The shortage of housing supply remains the main constraint on market stabilization. The European Commission directly links continued price pressure to insufficient volumes of new construction, high building costs, labor shortages, expensive land, and lengthy administrative procedures.
Even if monetary conditions normalize, the market will not automatically return to low growth rates. If supply remains tightly constrained, any renewed demand will once again translate into rising prices. In 2025, this was no longer just a hypothesis. It was an observable outcome, clearly reflected in the sharp divergence between countries.
Author

I write informative articles about real estate, investments, job opportunities, taxes, etc.